Elliott wave analysis helps to identify market or stock price segments. The next step is determining the Elliott wave count within the segment. Examination of the S&P 500 (SPX) Elliott wave pattern since 04/07/25 gives clues as to when the where the segment could end.
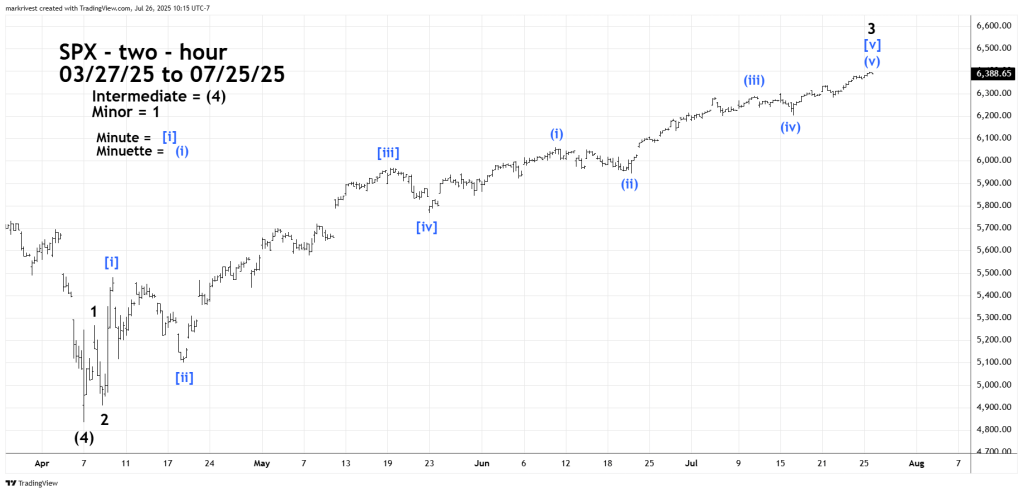
The two – hour SPX chart courtesy of Trading View illustrates a detailed Elliott wave count from the 04/07/25 bottom.
There are two main classifications of Elliott waves, Motive and Corrective.
Motive waves move the direction of the main trend and subdivide into five – waves.
Corrective waves move counter to the main trend and subdivide into three- waves or a combination of three waves.
There are three types of Motive waves: Impulse, Leading Diagonal Triangles, and Ending Diagonal Triangles.
The most common Motive wave type is Impulse. The wave count shown is a presumed developing Impulse.
Usually within an Impulse wave one of the three sub-Motive waves is extended – meaning you can see another five – wave subdivision within the sub wave.
For example, wave “one” and “five” of an Impulse wave appear as a single straight line. Wave “three” subdivides into a smaller five wave pattern.
This is what appears to have happened in the post 04/07/25 rally. The Minor “1” wave rally was very sharp and brief, followed by a presumed extended Minor wave “3” which may have terminated on 07/25/25.
Please note the action in April after the 04/07/25 bottom. Minor waves “1” and “2” are followed by Minute waves [ i ] and [ ii ]. This is called a series of one’s and two’s and the prelude to dynamic action, in this case up.
There’s another extension within Minor wave “3”. Note what happened after the 05/23/25 bottom labeled Minute wave [ iv ]. The subsequent rally could have been Minute wave [ v ], however after a shallow decline the rally continued. The move up from the 05/23/25 bottom appears to be Minuette wave ( i ) of another developing five – wave rally.
Caution, extensions can not be predicted, any fifth wave of a presumed impulse could be the first wave of the next five – wave movement.
Could there be further extension of the post 04/07/25 rally? Yes.
If the illustrated Elliott wave count is correct there could be a shallow decline in the next two to three trading days, followed by a short and sharp move to new highs.
Estimated time for what could be a significant SPX peak – 07/31/25 or 08/01/25.
