U.S. stock market momentum indicators imply a peak could be forming.
The daily S&P 500 (SPX) chart courtesy of BigCharts.com examines external momentum.
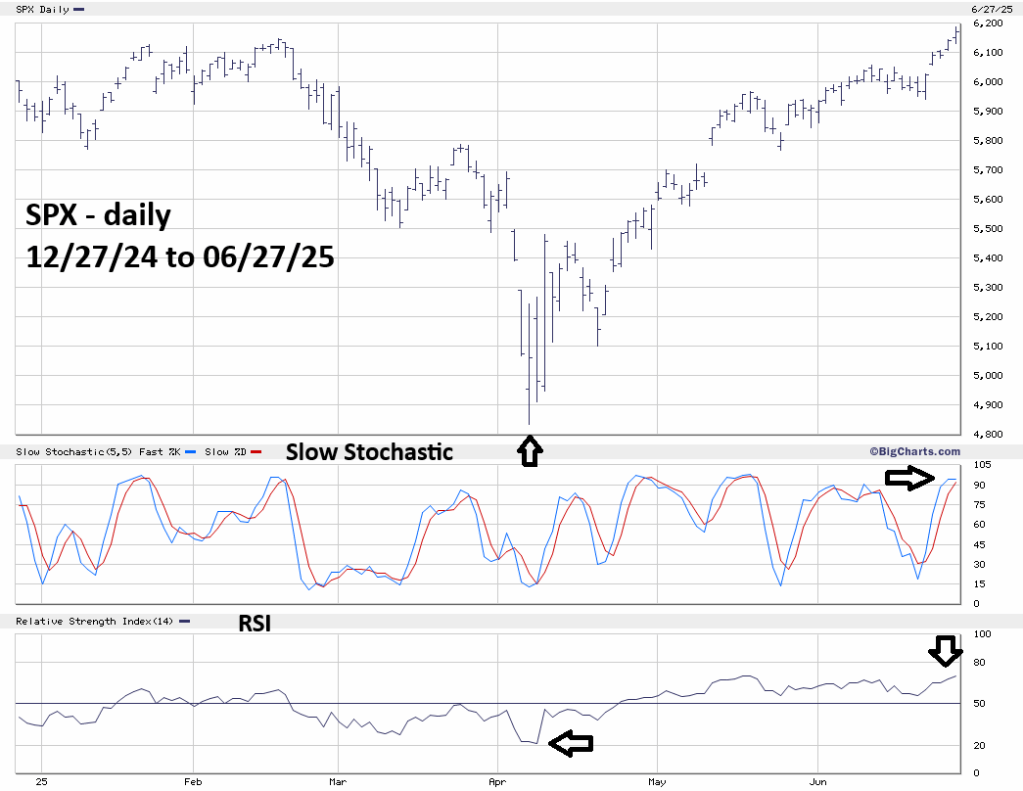
Momentum oscillators are like fuel gauges and can sometimes measure how far a market or a stock can move. The 06/23/25 blog “Reaction to Big News” noted.
“BigCharts.com Slow Stochastic is very effective at signaling turns. Daily Slow Stochastic has a bullish line cross. Please note that only one of the lines reached the oversold zone which begins at 20.00.”
If you view Slow Stochastic as a gas tank, having only one line reach the oversold zone implies the tank was not full as the SPX began its upward journey on 06/23/25. So far, the move up has been quick, and both Stochastic lines have reached the overbought zone above 80.00. Are the bulls out of gas? We may find out soon.
Daily RSI on 06/27/25 hit 70.00 which is the boundary of the overbought zone and its highest level since 04/07/25.
Most of the time stock index turns have at least one RSI divergence before a turn can be made. Please note that the SPX 04/07/25 bottom occurred with RSI at its lowest point of the February to April drop. This implies the early April bottom was made on maximum fear.
The SPX subsequent rally since 04/07/25 has been steep with several daily gap openings. Perhaps a June 2025 SPX peak is being made on maximum greed.
The hourly SPX chart courtesy of Trading View zooms in on the intraday momentum.
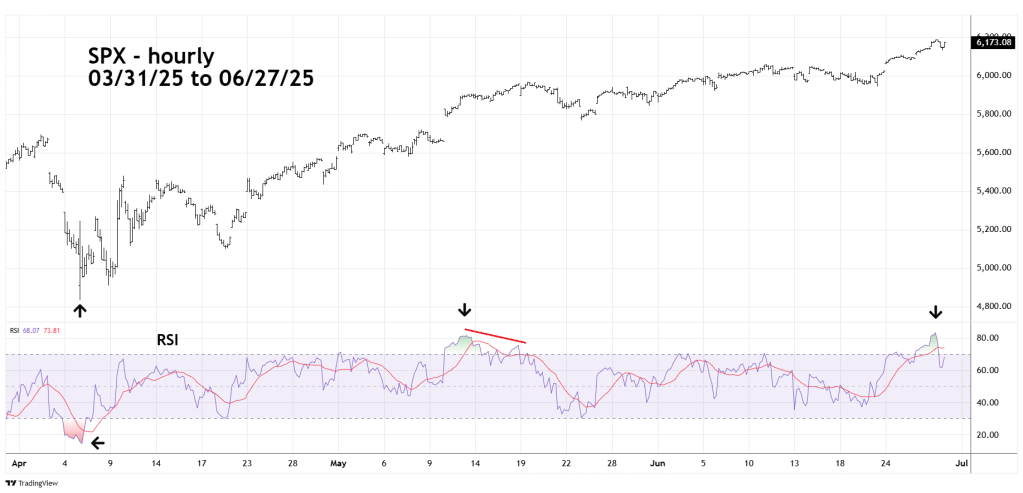
On an hourly scale RSI has also reached its highest level since 04/07/25. Please note the maximum oversold RSI at the 04/07/25 bottom.
If the SPX can make a new all-time high on 06/30/25 there’s a very good chance hourly RSI could have a bearish divergence.
The NYSE – 52 – week high chart courtesy of Barchart.com examines internal momentum.

The picture from the NYSE – 52 – week highs is mixed. The level reached on 06/27/25 is below the maximum recorded on 01/30/25 and on 02/14/25, which was just before the prior SPX all-time high. Shorter – term new highs are at the highest level of the post April 2025 rally. This could be a similar signal to the daily SPX – RSI.
