The S&P 500 (SPX) is near three important Fibonacci coordinates and could make a significant peak on 06/27/25.
The weekly SPX chart courtesy of Trading View illustrates long – term Fibonacci resistance.

Within Elliott motive waves there’s usually a Fibonacci relationship between the first and fifth waves. When measuring larger percentage movements, it’s usually more appropriate to compare growth rates.
The growth rate of the presumed Intermediate wave (1) was 119.8% multiplied by the Fibonacci ratio of .236 yields a growth rate of 28.2%.
Adding a growth rate of 28.2% to the presumed Intermediate wave (4) bottom at 4,835.04 targets SPX 6,202.51 as an Intermediate wave (5) peak.
The 30 – minute SPX chart zooms in on the intraday Elliott wave count.
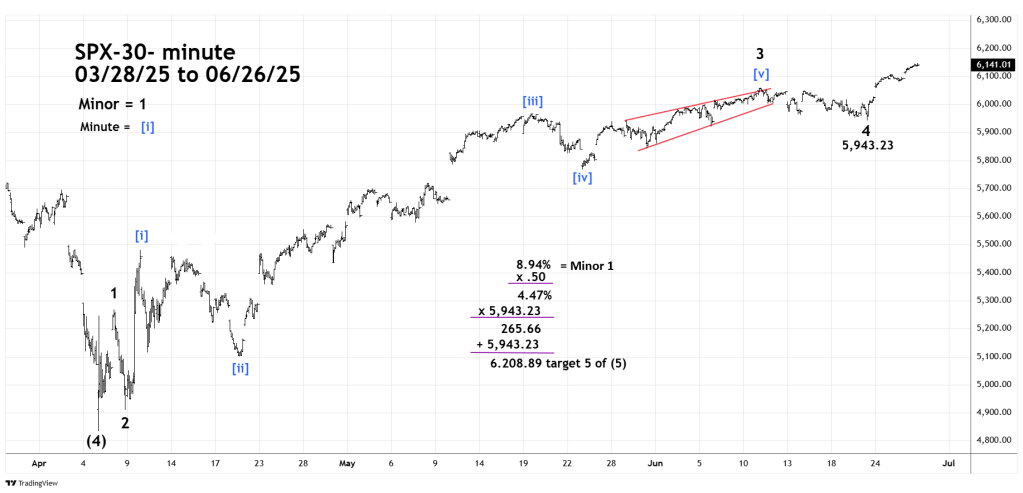
Using the same wave relation concept has a growth rate of 8.94% for Minor wave 1.
Multiplying 8.94 by a Fibonacci ratio of .50 equals a growth rate of 4.47% added to the presumed Minor wave 4 targets SPX 6,208.89 for a Minor wave 5 peak.
The SPX 02/19/25 peak at 6,147.43 is also a Fibonacci coordinate. The SPX high on 06/26/25 was 6,146.52 which is almost a 100% retracement of the February to April decline – the Fibonacci equality ratio of 1/1.
It’s possible the SPX made a significant peak on 06/26/25. This would be a truncated fifth wave in which the third wave fails to exceed the termination point of the third wave.
It’s more likely the SPX could move above the 6,147.43 peak on 06/27/25. If so, a significant SPX peak could be made marginally above 6,147.43.
Broad SPX resistance zone is 6,150 to 6,220.
