Elliott wave analysis reveals two courses the S&P 500 (SPX) could take in the coming weeks.
On a bar chart the SPX rally after 04/07/25 has several Elliott wave interpretations. Using line charts sometimes clarifies the Elliott picture. In this case it reveals two possible scenarios.
The daily SPX chart courtesy of Trading View illustrates the bullish scenario.
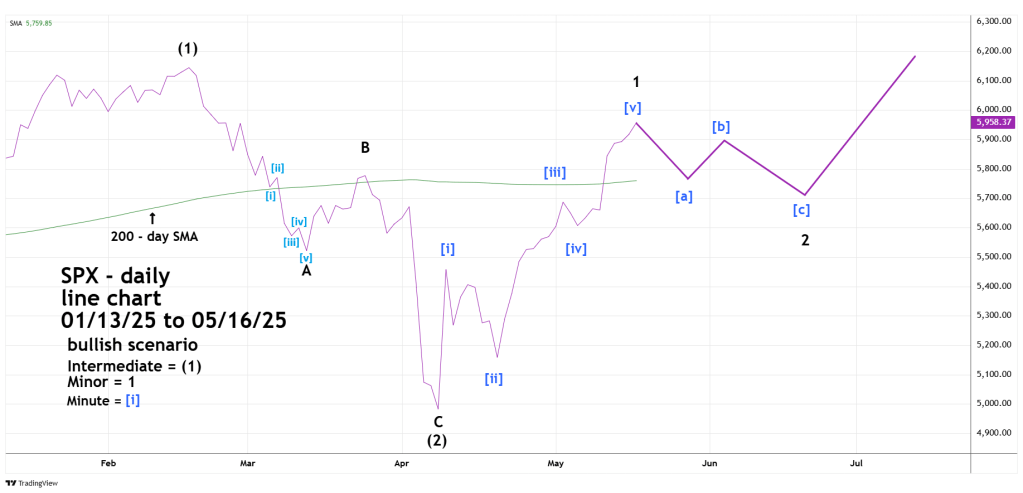
The key to both scenarios is the post 04/07/25 rally which on a line chart reveals an Elliott five wave pattern.
The broader count from the 02/19/25 peak is an Elliott wave – Single Zigzag correction of the prior up trend. The rally after 04/07/25 if complete is the first wave up of a larger developing five – wave pattern to new all- time highs.
Please note that in the presumed Single Zigzag down Minor wave “A” is an extended Impulse wave, while Minor wave “C” is three waves down. Waves “A” and “C” of Single Zigzag do not have to be symmetrical. Single Zigzags can be composed of a five – three – five combinations, a three – three – three combinations, five – three – three, or three – three – five.
Also note the location of the SPX – 200 – day Simple Moving Average (SMA). Recent blogs on this website have noted that when a market or stock near its 200 – day SMA the line tends to act as support/resistance. Last week the SPX moved decisively above the 200 – day SMA. Presumably if there’s any near -term decline the bulls defend the 200 – day line keeping the drop shallow.
The next daily SPX chart shows the bearish scenario.
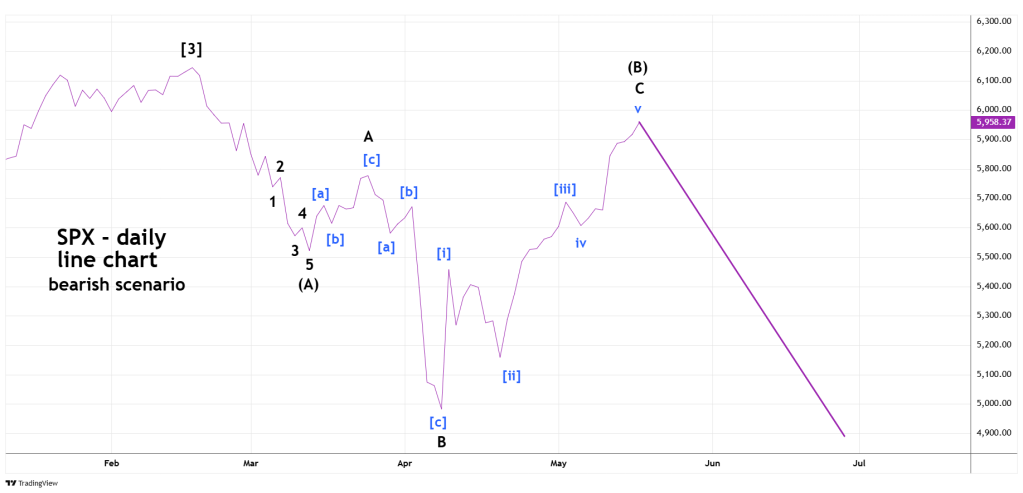
In this case there’s an extended five – waves down followed by an Inverse – Expanding Flat. This structure is composed of three waves. The first wave up – “A” subdivides into three. The second wave down – ‘B” is composed of three waves which goes below the point of origin of the first wave. The third wave up – “C” sub divides into five – wave which goes beyond the termination point of the first wave.
If this wave count is correct the next decline has a high probability of moving below the 04/07/25 bottom.
There’s a very good chance for the SPX to decline on 05/19/25. After the end of the main U.S. stock trading session at 4:00 PM – EDT on 05/16/25 Moody’s announced it was downgrading U.S. debt. S&P 500 Futures declined on the news.
The next daily SPX chart shows what happened after Fitch downgraded U.S. debt in August 2023.

It’s possible the SPX could soon be in a decline that brings it below the 04/07/25 bottom.
The main factor may be how well the bulls defend the 200 – day SMA.
Watch the SPX – 200-day SMA.
