There’s a high probability that the U.S. 30 – year Treasury Yield (TYX) has completed a multi- month Elliott wave – Horizontal Triangle.
The 05/11/25 blog “The Treasury Triangle” illustrated that TYX was probably forming an Elliott wave – Horizontal Triangle since October 2023. These structures are sideways corrective patterns which sub divide into five – waves, each sub wave further subdivides into three waves or a combination of three waves.
The daily TYX chart courtesy of Trading View updates the action.
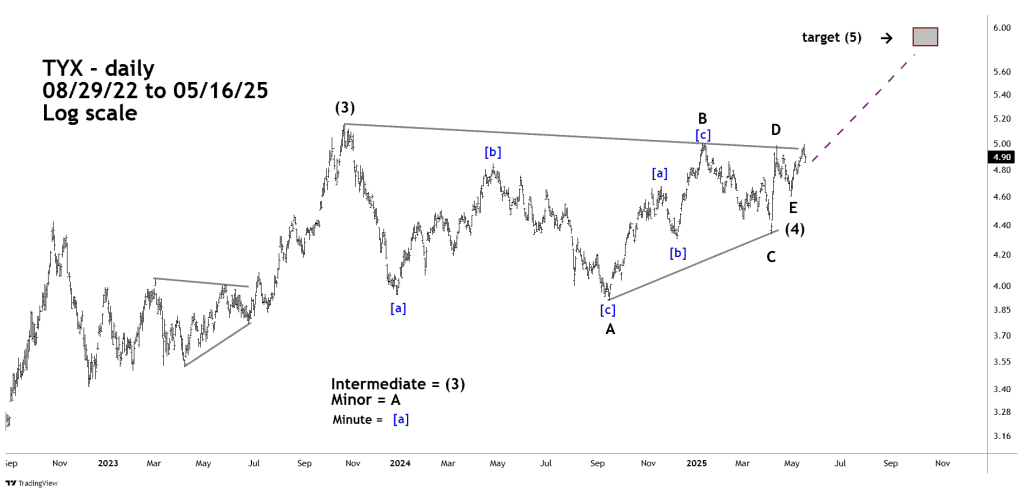
Minor waves “A” and “B” have clear three wave structures and are Elliott wave – Single Zigzags.
The projection of a rally to the 6.00 area is based on the widest part of the post October 2023 Horizontal Triangle which is Minor wave “A”. Adding the length of Minor wave “A” to the presumed Minor wave “E” termination point on 04/30/25 targets TYX 5.85.
Also please note the smaller degree Horizontal Triangle which ended in June 2023.
A detailed examination of Minor waves “C” through “E” is illustrated in the next daily TYX chart.

The choppy Minor wave “C” is an Elliott wave – Double Zigzag. The subsequent fast and sharp rally has the look of an Elliott Impulse pattern, however there is a clear three wave subdivision.
Minor wave “E” is a clear three wave Single Zigzag.
Note that the subsequent rally has gone above the peak of Minor wave “D”, this implies the Horizontal Triangle from October 2023 is complete. There are always alternate wave counts, and since the rally has not exceeded the peak of Minor wave “B” it could mean Minor wave “D” has formed a Double Zigzag.
This alternate wave count is not likely to happen because after the main U.S. stock session ended at 4:00 PM – EDT on 05/16/25 there was a major news announcement.
Moody’s one of the main credit rating agencies downgraded long – term U.S. debt.
The next daily TYX chart from 2023 shows what happened to long – term U.S. debt yields after a downgrade.
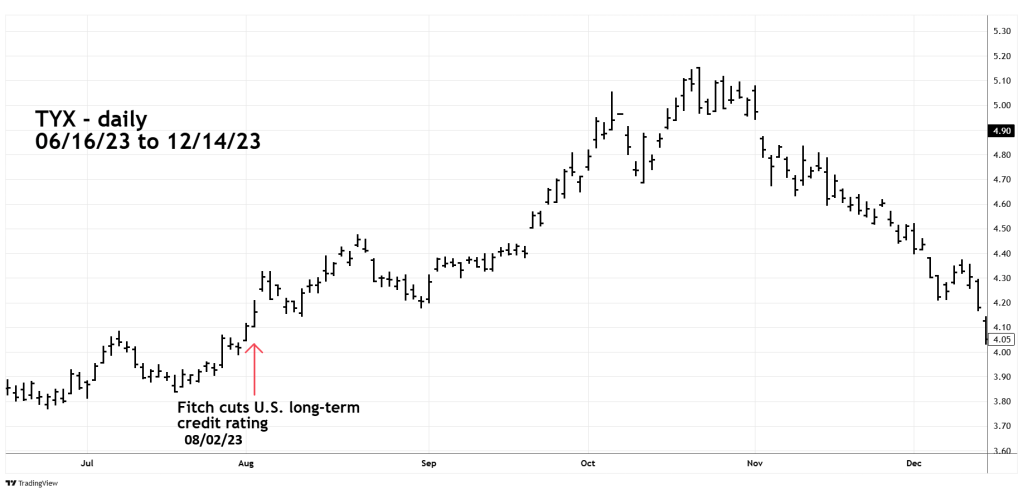
After the Fitch downgrade in early August 2023 U.S. long -term yields climbed about one percentage point. Please note that the downgrade occurred after the smaller degree Horizontal Triangle ended in June 2023.
It’s possible there could be another multi month one percent rise in yield after the current downgrade. If so, it aligns with the Elliott wave projection for TYX to reach the 6.00 area.
TYX made significant peaks in October 2022 and October 2023. Perhaps the next important peak could come in October 2025?
