The S&P 500 (SPX) has been above its 200 – day Simple Moving Average (SMA) all week.
The daily SPX chart courtesy of Trading View updates the action.
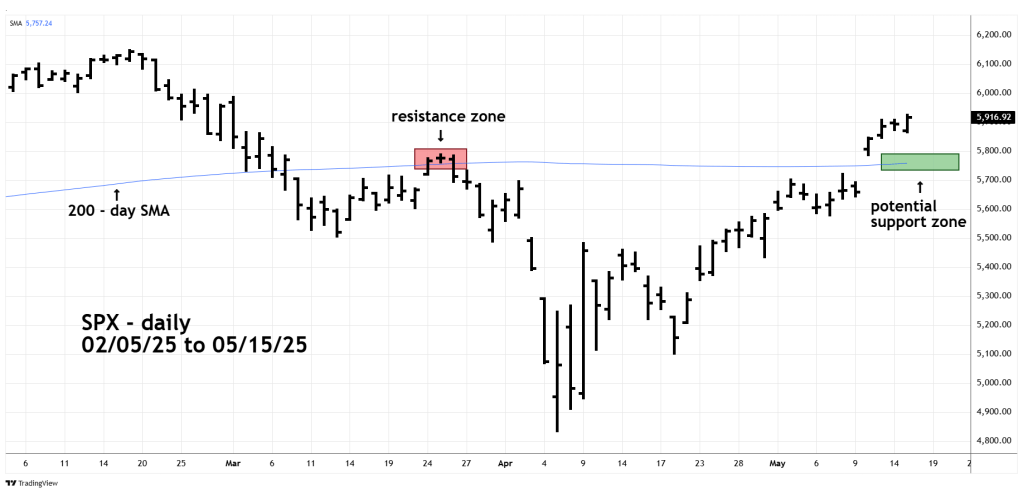
The move above the line on 05/12/25 was decisive and today 05/15/25 the SPX continued to move further above the line.
Any short-term decline is likely to find support at or near the 200 – day SMA. Please note how the line proved to be resistant after the SPX decisive break below the line in early March.
If the SPX has a strong move back below the line and stays below for several trading days, it could signal a move back to the early April lows.
