There is no predestination in Elliott Wave theory. The mass mind like the individual mind can change direction, there are always alternate Elliott wave counts. The CBOE 30 – Year U.S. Treasury Bond Yield (TYX) may have completed a fascinating alternate Elliott wave count.
The 02/02/25 blog “A Super Rally for U.S. Interest Rates?” noted.
“If TYX can decisively move above 5.152 it could reach 7.00 or higher sometime in 2025.”
A rise in long – term U.S. interest rates is still likely for 2025, however a peak in rates could be below 7.00.
The daily TYX chart courtesy of Trading View shows what may be happening.
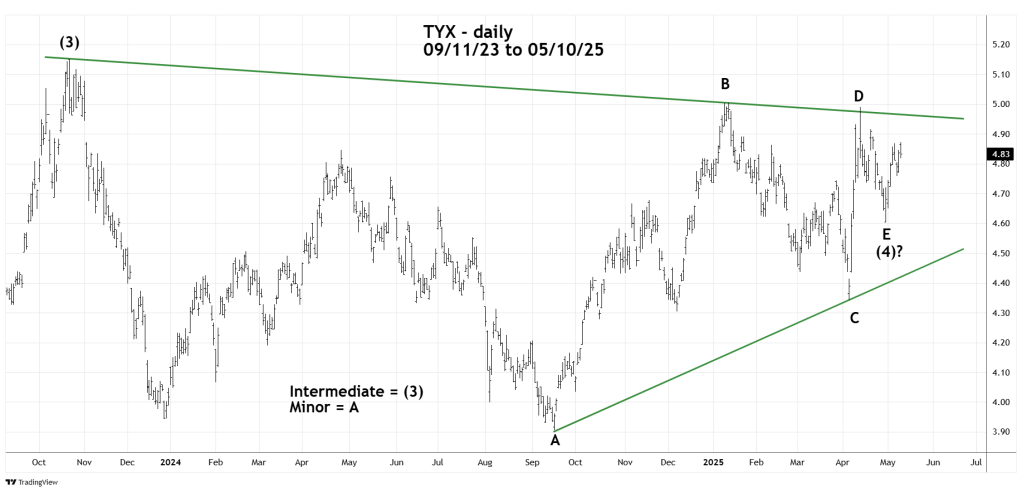
TYX after the October 2023 peak may have completed an Elliott wave – Horizontal Triangle. These structures are sideways corrective patterns which sub divide into five – waves, each sub wave further subdivides into three waves or a combination of three waves.
Minor wave “A” has a clear three wave Single Zigzag. Minor wave “C” is a choppy Double Zigzag. Please note that the fast and sharp Minor wave “D” divides into three waves. Minor wave “E” divides into three waves however, it has terminated far above the rising trendline, its possible a Double Zigzag could be forming. Caution, “E” waves can be sneaky. It’s common for them to be smaller than expected and terminate prior to a target.
If the Horizontal Triangle is complete TYX could be in the early part of a post triangle thrust up that takes it beyond the October 2023 peak at 5.152.
The weekly TYX chart illustrates where the Horizontal Triangle could fit in with the larger Elliott wave structure.
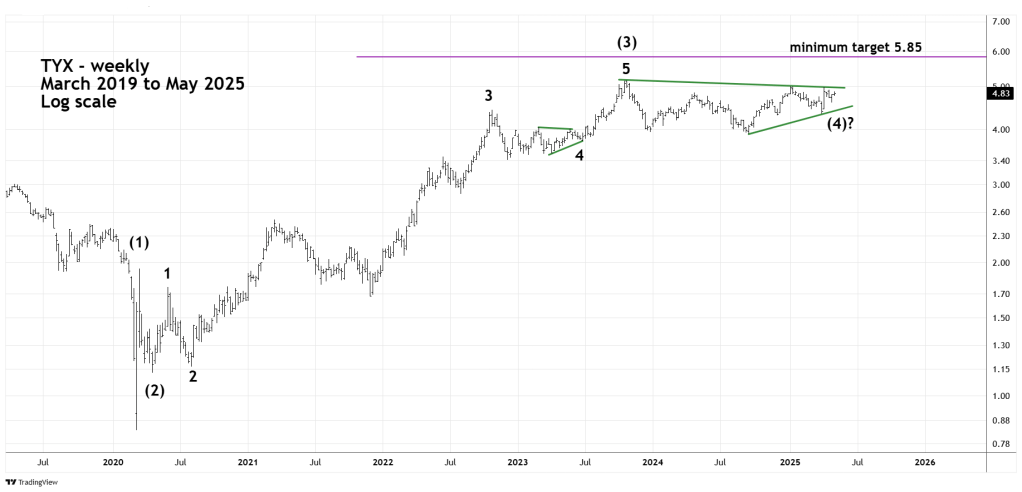
The 11/12/23 blog “U.S. 30 – Year Treasury Yield – Elliott Wave Count 11/10/23” Illustrated that a Primary degree wave [1] may have been completed at the October 2023 peak. It’s probable that this peak may have only been an Intermediate wave (3). The wave count illustrated in the 11/12/23 blog had the TYX bull move from 2020 to 2023 as an extended Elliott wave impulse pattern. The alternate wave count in the current blog is an even more extended pattern.
Note the basing pattern in 2020 after the major bottom made in March 2020, this is an Elliott wave series of waves one’s and two’s, followed by a long and powerful wave three. The corresponding ending action of a series of one’s and two’s is a series of four’s and five’s.
Note the smaller Horizontal Triangle – Minor wave “4” that formed from October 2022 to June 2023 this was the first wave four. The subsequent rally into October 2023 peak was the first wave five.
The net sideways correction after October 2023 is the presumed completed second wave four. A subsequent move above 5.152 could be the expected second wave five.
Typically, the movements after a Horizontal Triangle are measured by the widest part of the triangle which in this case is Minor wave “A”. The length of Minor wave “A” added to the triangle’s termination point of Minor wave “E” derives the target. In this case the area is around 5.85.
The prior two significant TYX peaks occurred in October 2022 and October 2023. Perhaps the next significant peak could be made in October 2025.
