The S&P 500 (SPX) 50 – day- Simple moving average (SMA) is on the verge of crossing below the 200 – day SMA. This presumably bearish signal called the “Death Cross” could trigger more downside action.
The daily SPX chart courtesy of Trading View shows what’s happening.

A Death Cross could happen in one or two trading days. If so, this could initiate an SPX decline to at least the low 4,500 area.
The next daily SPX chart illustrates what happened after the prior two Death Cross signals.
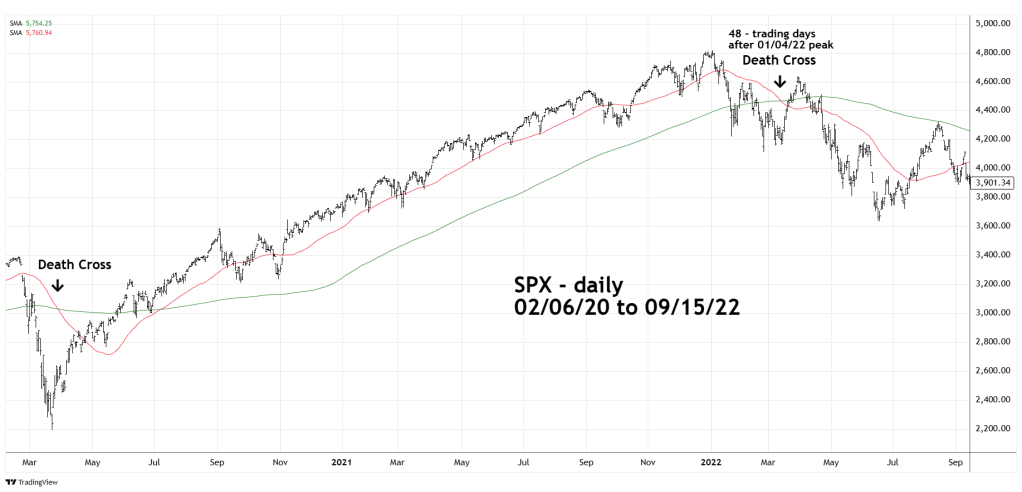
In early 2020 the SPX declined so fast that the Death Cross signal occurred after the crash bottom.
During the 2022 bear market the Death Cross came about 48 – trading days after the 01/04/22 primary peak. This signal happened at an intermediate bottom. Subsequently there was a two-week rally before the bear market resumed. As of 04/11/25 the SPX was about 37 – trading days after the 02/19/25 primary peak. It’s possible something like the early 2022 scenario could occur in 2025.
The next SPX daily chart shows three Death Cross signals from 2015 to 2018.

The August 2015 signal came at the mini crash bottom. The next signal in early 2016 was effective, subsequently the SPX went into a sharp two – week drop. The December 2018 Death Cross also heralded a sharp two – week decline.
The Death Cross is a lagging indicator that can sometimes occur at or just after a stock market bottom.
If the next Death cross signal is effective, it could be the prelude for a one- or two-week SPX decline to 4,500.
