There are two ways to use Fibonacci time analysis, ratios or sequence numbers. With ratios a market rally lasting 100 – days could be retraced in 61 – days. This is the Fibonacci ratio of 61/100 or .61.
Sometimes market movements can be measured by numbers in the Fibonacci sequence.
The Fibonacci sequence is as follows (1, 1, 2, 3, 5, 8, 13, 21, 34, 55, 89, 144, to infinity).
The daily S&P 500 (SPX) chart courtesy of Trading View shows what happened in 1987.
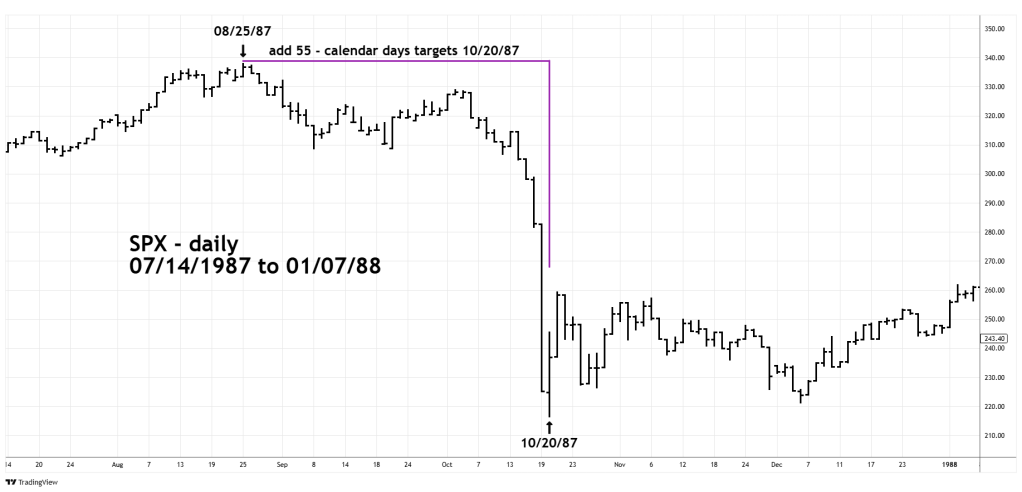
The SPX 1987 bull market peak was on 08/25/87 adding 55 – calendar days targets 10/20/87 which was the day the August to October 1987 ended.
The next daily SPX chart shows what could happen in April 2025.
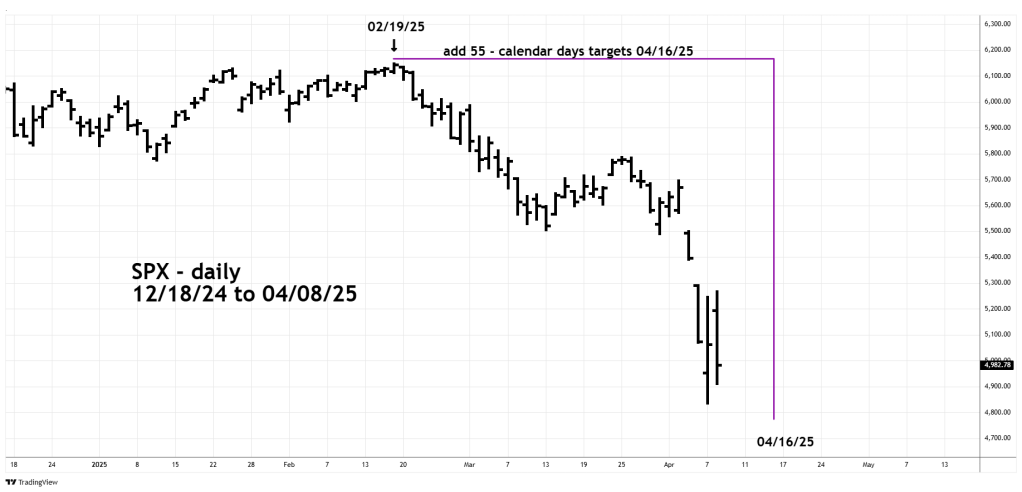
The SPX 2022 to 2025 bull market peak was on 02/19/25 adding 55 – calendar days targets 04/16/25 as a potential 2025 crash bottom.
The 04/16/25 date corresponds with Fibonacci time ratio analysis illustrated in the 03/30/25 blog “Alternate Time Forecast for Intermediate S&P 500 Bottom”.
Sometimes markets can turn on New/Full Moons plus or minus two trading days.
There’s a Full Moon Sunday April 13th.
The broad time zone or a potential crash bottom is 04/14/25 to 04/16/25.
