Today 04/07/25 the S&P 500 (SPX) bottomed out just above the SPX peak made in January 2022. Please see this website 04/06/25 blog. Assuming this bottom does not hold, there’s another support area that could be reached next week.
The daily SPX – Point & Figure chart courtesy of StockCharts.com illustrates a possible support area.
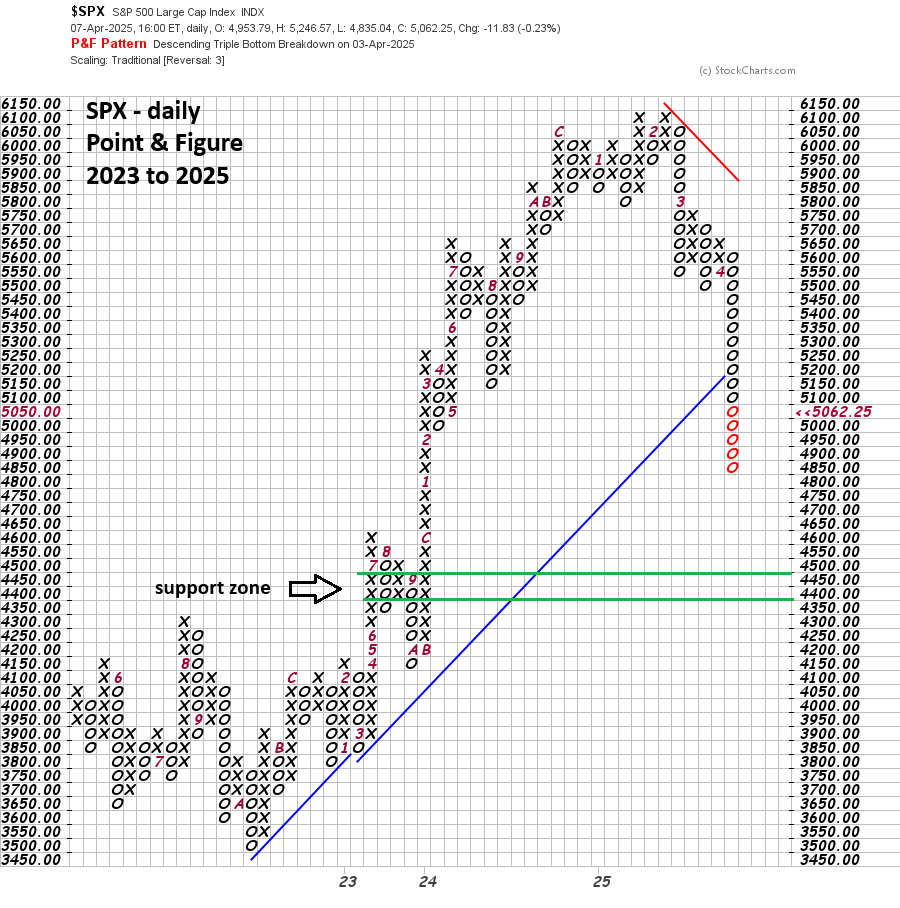
Point & Figure charts are very effective in identifying potential support/resistance. Moves up are designated with “X” moves down are noted as “O”. The longer the columns of “X’s” and “O’s” the greater the potential support/resistance.
Note that there are five – columns and two rows of “X’s” and “O’s” around SPX 4,400 to 4,500.
Also note that the long-term rising trendline has been broken and that the current SPX low is not in an area of support. This implies the SPX is vulnerable to more downside action.
The next daily SPX chart courtesy of Trading View shows Volume Profile.
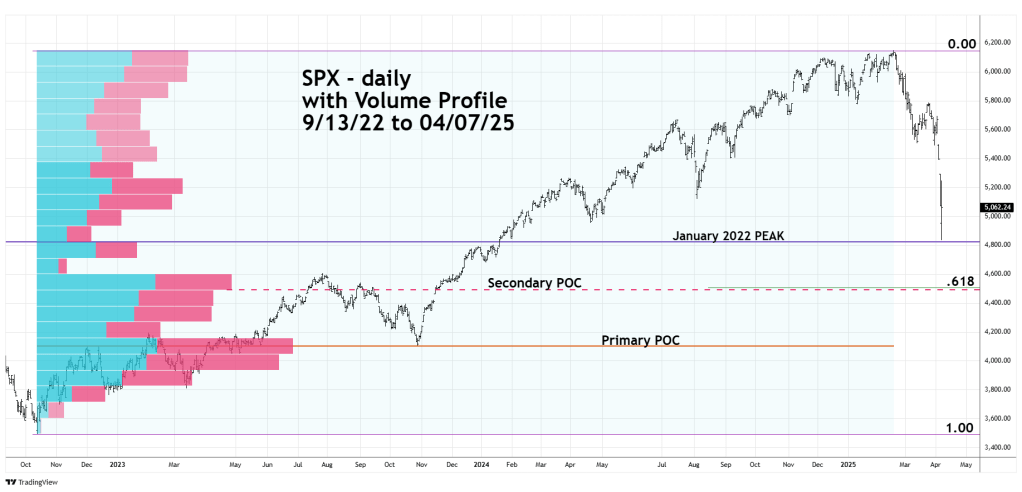
The widest part of Volume Profile is called “Point of Control” (POC) and represent the strongest potential support/resistance area.
A Fibonacci .618 retracement of the SPX – 2022 to 2025 bull market is close to 4,500 which is also very close to the lower border of Secondary POC.
If the SPX 04/07/25 bottom does not hold, there’s a good chance the SPX could reach 4,400 to 4,500 area sometime next week.
