A very effective indicator to determine the long – term trend of a market or a stock is the 200 – day moving average of price. Generally, when price is above the 200 – day moving average, the trend is bullish. When the price is below the average the trend is bearish. When price is at or near the moving average line a closer examination is needed.
A look at the history of the 200 – day average in relation to bull and bear markets gives clues to what may soon happen to the U.S. stock market.
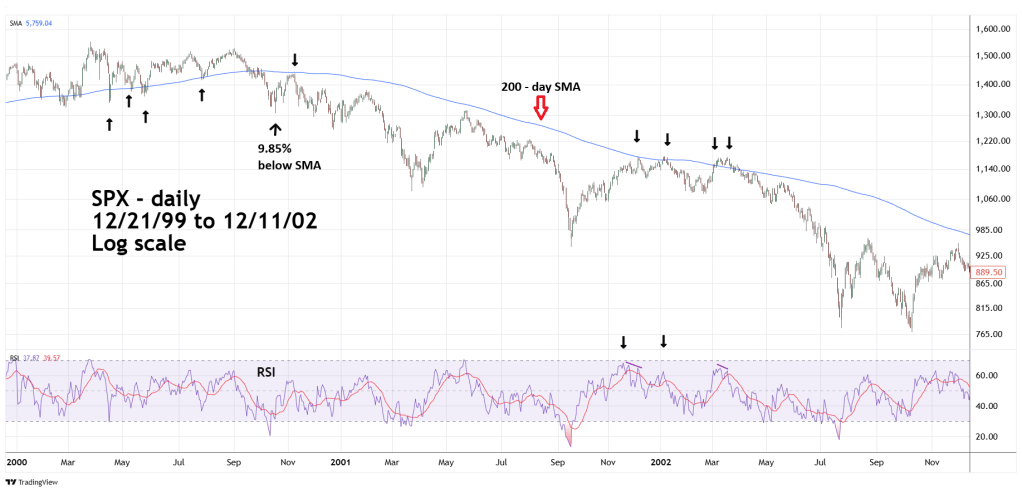
The daily S&P 500 (SPX) chart courtesy of Trading View shows what happened during the 2000 to 2002 bear market.
There are various ways to calculate a moving average of price. The method chosen for the following illustrations is the “Simple Moving Average” (SMA).
The SPX made a major bull market peak in March of 2000. Note the buying that occurred after March of 2000 when the SPX went below the 200 – day SMA. From April to July 2000 the bulls believed the primary market trend was still up and used breaks below the 200 day – SMA as a buy signal.
In October 2000 something different happened, the SPX had a significant break below the 200 – day SMA of 9.85%. After this bearish kick off the SPX subsequently found resistance at the 200 – day SMA.
Sometimes, the RSI indicator with the 200 – day SMA can aid in discovering potential peaks. Note that from December 2001 to March 2002 SPX moves to and above the line had RSI readings near the overbought zone and subsequently had bearish divergences.
The next SPX daily chart illustrates the bull market from October 2002 to early 2006.
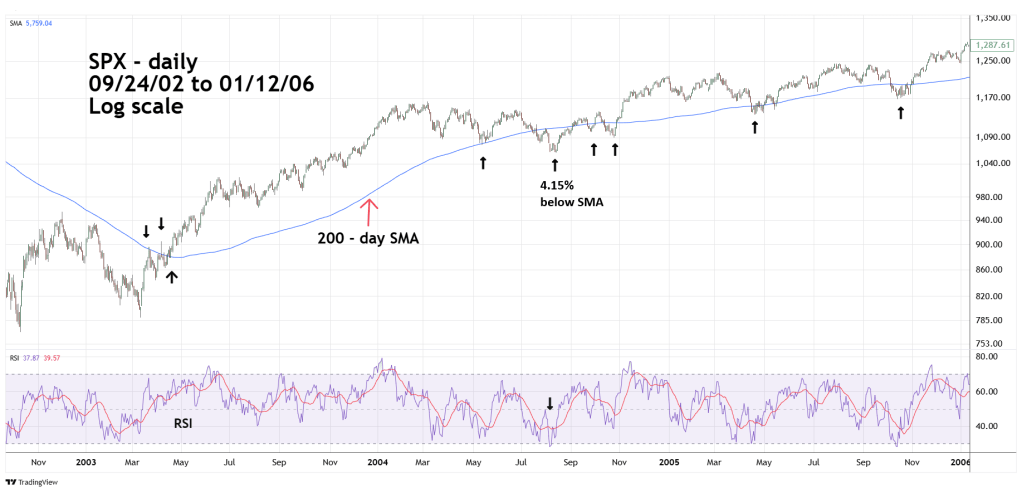
Note that in March 2003 SPX found resistance at the 200- day SMA. This is an example of some market participants believing the primary trend was still down. In early April 2003 there was a stronger move above the 200 – day SMA, yet this attempt also failed. It wasn’t until later in April that the price was able to significantly move above the line.
From May to October 2004, SPX made several moves to and below the line. The largest was 4.15% in August 2004. Again, RSI was useful in determining the longer – term trend. Note that RSI reached the oversold zone in August 2004.
The next daily SPX chart examines recent movements.
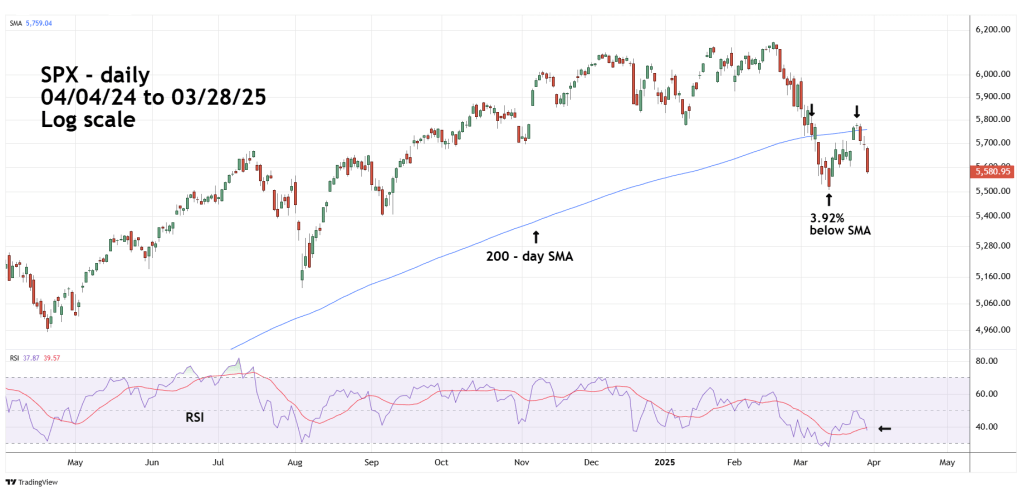
On 03/06/25 the SPX made its first move below the 200 – day SMA. The subsequent rally above the line was very brief and on 03/07/25 the SPX moved back below the line.
On 03/13/25 SPX was 3.92% below the 200 – day SMA with RSI in the oversold zone. A case could be made that this is evidence of a correction within the bull market that began in October 2023. However, the SPX action on 03/28/25 argues strongly against this theory.
On 03/28/25 the selling was vicious! After the SPX high of the day made at 9:39 AM – EDT the bears were in total control driving prices down throughout the session.
Additionally, the SPX moved below the Fibonacci .618 retracement of the 03/13/25 to 03/25/25 rally and there’s no chart support until the 03/13/25 bottom.
There’s a very good chance the SPX could very soon break below the 03/13/25 bottom. If so, this could be another very significant bearish signal.
