On 02/14/25 the S&P 500 (SPX) peaked at .71 points below its all-time high made on 01/24/25. Could this be the prelude to a significant upside breakthrough, or could something else be happening? Detailed Fibonacci analysis reveals some amazing clues.
The weekly SPX chart courtesy of Trading View illustrates the long-term Elliott wave count since the bottom made in October 2022.
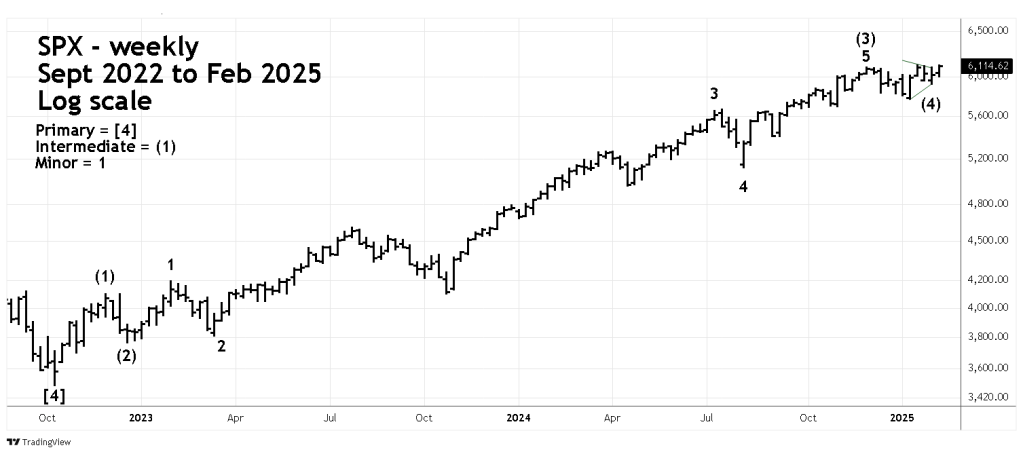
This chart is almost identical to the SPX weekly chart shown in the 01/25/25 blog “Evidence of a Major U.S. Stock Market Top 01/24/25”. The only difference is the Elliott wave action after the 12/06/24 peak.
Within Elliott motive waves there’s usually a Fibonacci relationship between waves “two” and “four”. Intermediate wave (2) of this extended Impulse wave declined 8.2%. The deepest part of the presumed Intermediate wave (4) which bottomed out on 01/13/25 was a decline of 5.3%. The ratio of the two waves is 5.3/8.2 which equals .64 close to the Fibonacci ratio of .618.
When measuring the wave relationships where there’s a large percentage gain, its more appropriate to compare growth rates.
The growth rate of Intermediate wave (1) was 17.4%. This growth rate could be an important factor in the next few trading days.
The daily SPX chart zooms in on the action since June 2024.

Again, most of the wave count is the same as illustrated in the 01/25/25 blog. Please note what happened after the 12/06/24 top. It looks like Intermediate wave (4) formed an Elliott wave – Horizontal Triangle.
The SPX 30 – minute chart examines the presumed Horizontal Triangle.
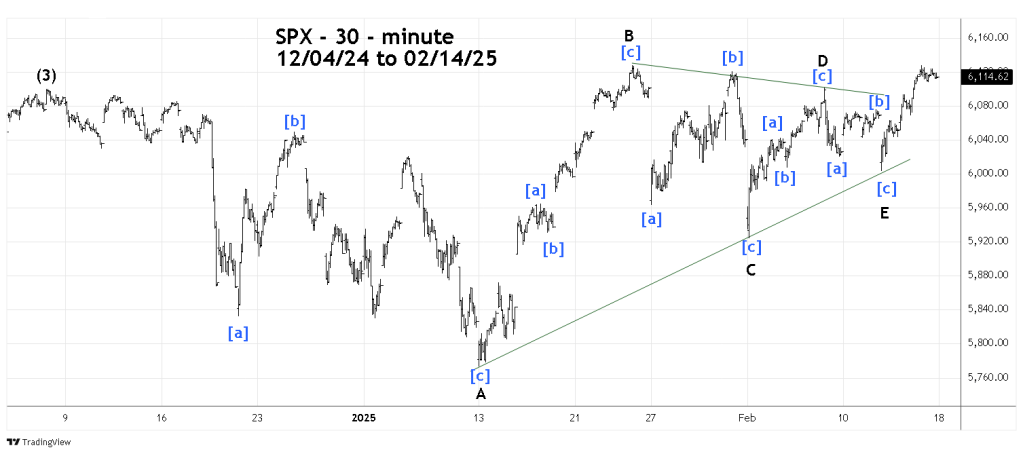
Elliott wave – Horizontal Triangles are net sideway corrective pattens composed of five sub – waves, each of which subdivide into three waves or a combination of three waves. Most of the Horizontal Triangles form within converging trendlines. There are four different types of Horizontal Triangles. The presumed triangle illustrated is called a “Running Triangle” in which wave “B” marginally exceeds the point of origin of wave “A”.
The only flaw with the post 12/06/24 triangle, is the presumed Minor wave “B” which looks more like an impulse pattern than a corrective pattern. Sometimes this can happen especially in fast-moving markets.
Please note that the 01/25/25 blog illustrated the SPX 01/13/25 to 01/24/25 rally as an impulse pattern – Intermediate wave (5). If the SPX high on 01/24/25 is not exceeded the wave count illustrated in the 01/25/25 blog would be correct.
Fibonacci analysis of the action from 12/06/24 to 02/12/25 implies the SPX could soon make a new all-time high.
There are usually Fibonacci relationships between alternate waves of a Horizontal Triangle.
The lengths of the five sub waves is as follows.
Minor wave “A” is 326.59
Minor wave “B” is 354.87
Minor wave “C” is 204.25
Minor wave “D” is 177.35
Minor wave “E” is 98.28
The ratio of C/A is 204.25/326.59 equals .625 close to the Fibonacci ratio of .618.
The D/B ratio is 177.35/354.87 equals .499 almost the Fibonacci ratio of .50.
The E/C ratio is 98.28/204.25 equals .481 close to the Fibonacci ratio of .50.
Usually, the movement after a Horizontal Triangle can be measured by the widest part of the triangle added to the termination point of the triangle – in this case the Minor wave “E” bottom. The widest part of this triangle is Minor wave “B”, which had 354.87 points, added to the Minor wave “E” bottom of 6,003.00 targets an intermediate wave (5) peak at 6,357.87.
This target is unlikely to be achieved because of incredible bearish momentum divergences.
The bearish momentum divergences will be examined in this websites next blog.
If the SPX can reach a new all-time high it could be marginally above the current high of 6,028.18. The calculations for a marginal new high will be illustrated in the next blog.
One final note, if the SPX can reach a new all-time between 02/18/25 to 02/20/25, it would be close to the five -year anniversary of the major SPX top made on 02/19/20.
