On 02/07/24 Tesla Inc. (TSLA) broke decisively below important support. This movement implies the start of a significant move down to near 215.00 sometime in February or March 2025.
The daily TSLA chart courtesy of Trading View shows the action since June 2024.
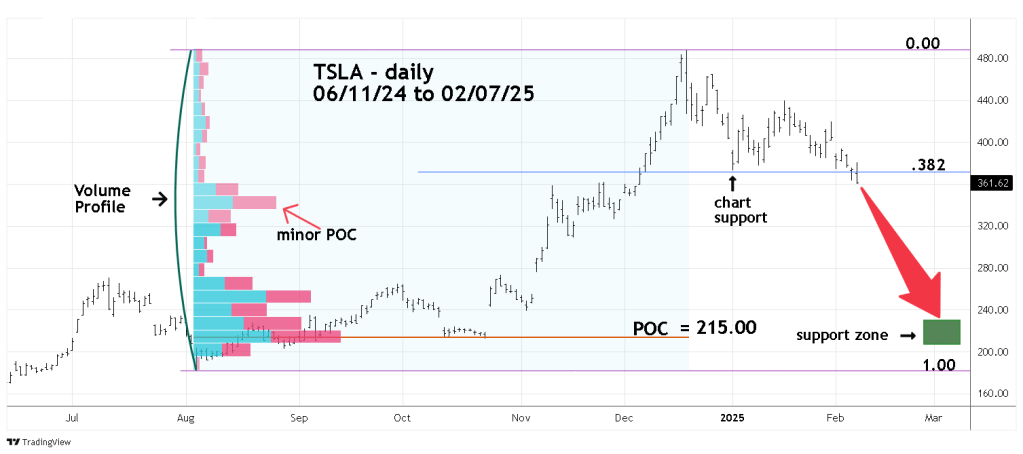
The Volume Profile indicator is a great forecasting tool to discover potential support/resistance zones. Volume is placed on a vertical axis to match price. The widest part of the profile is called Point of Control (POC) which represents the strongest potential support/resistance.
The Volume Profile for TSLA covers the period from 08/05/24 to its all-time high on 12/18/24.
On 02/07/25 TSLA ended the main trading session at 361.62. There’s a minor POC in the 340.00 area. If price can reach this zone it could be temporary support. A break below 340.00 could open the door down to the primary POC near 215.00. Please note this POC corresponds to several days of chart support made in October 2024.
The action TSLA took on 02/07/25 could be very important.
Note that on 01/02/25 TSLA made a bottom just above a Fibonacci .382 retracement of the August to December rally. On 02/06/25 TSLA broke below this support then rallied back to end the session above the support level. On 02/07/25 TSLA initially moved up, then ended the session below the 02/06/25 bottom.
There’s a high probability the 02/07/25 movement could be the beginning of a strong move down in the coming weeks. If you think a decline of about 40% in a few weeks is too large, please note how rapid the rally was in late 2024.
TSLA has been one of the strongest upside performing stocks in the U.S. market. Its action on 02/07/25 could be another bearish signal for the U.S. stock market.
