The 01/25/25 blog “Evidence of a Major U.S. Stock Market Top – 01/24/25” illustrated that U.S. stocks could be on the verge of at least a multi-month bear market. Assuming the hypothesis is correct, Volume Profile analysis could be helpful discovering potential support zones in a developing bear market.
The Volume Profile method places volume on a vertical axis, matching volume with price action. The widest part of the profile is called Point of Control (POC) and represents the strongest potential support/resistance.
The daily S&P 500 (SPX) chart courtesy of Trading View illustrates the short – term trend.

Volume Profile in this case covers the period from the 08/05/24 mini-crash bottom to the 01/24/25 SPX all-time high. Note that the widest part of the Volume Profile is near the short-term bottoms made in early October and early November 2024.
Its possible the SPX could reach this support zone sometime in the 02/14/25 to 02/21/25 time frame.
The next daily SPX chart examines the intermediate – term trend.
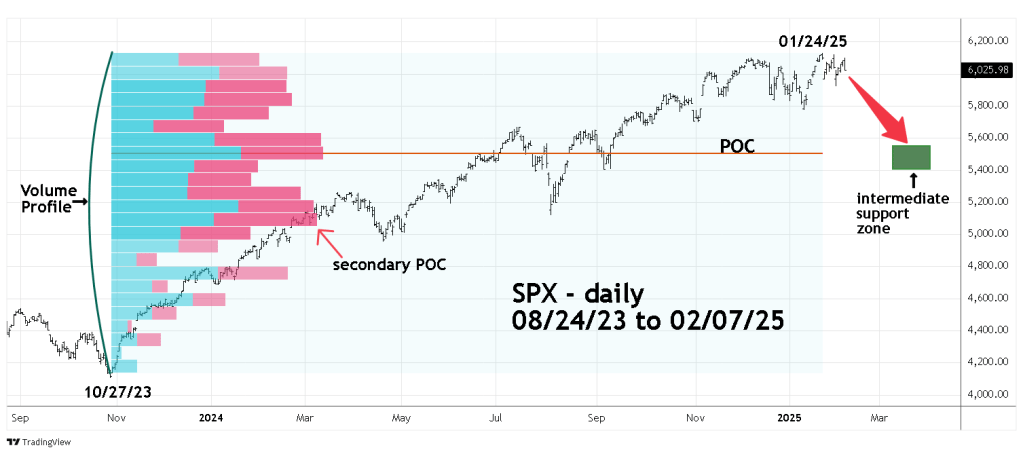
This chart analyzes the Volume Profile action from the significant bottom in October 2023 to the SPX peak in January 2025. The POC corresponds with the bottom made in early September 2024. Please note that below the primary POC there’s a slightly smaller secondary POC which is near the April 2024 bottom. If the SPX can reach the area of the primary POC, there could be a short-term rally then another drop down to the bottom made in April 2024.
It could take several weeks of decline to reach the potential support zones. Possibly April or May 2025.
The weekly SPX chart shows the long-term trend since the March 2020 crash bottom.

The long – term POC is in the area of the July to October 2023 decline. This was the largest bear phase of the 2022 to 2025 bull market. Seasonally October is the most likely month for significant U.S. stock market bottoms. If the SPX does have a large drop in the coming months, October 2025 is the most likely time zone for an important bottom.
Also note that below the primary POC there is an almost identical secondary POC that’s in proximity to the October 2022 bottom.
If there’s a significant SPX bottom made in October 2025 it could trigger a multi-month rally into early 2026. If the rally fails it could be the prelude to the next bear phase which could reach the October 2022 bottom sometime in the second half of 2026.
If this scenario plays out there could be symmetry of a just over two-year bull market followed by a nearly two – year bear market.
The long, intermediate and short-term Volume Profile analysis illustrates several areas of potential support if a new bear market has begun. It is unlikely that a U.S. stock market crash on the degree of what happened in 1929, 1987, and 2020 could occur.
A choppy decline is what could be ahead for U.S. stocks. The SPX mini – bear market from January 2022 to October 2022 could be a preview of coming action.
