On 01/23/25 of the three main U.S. stock indices only the S&P 500 (SPX) continued to make all- time highs. The Dow Jones Industrial Average and Nasdaq Composite (IXIC) are still below their ultimate highs made in December 2024. If two of the three main U.S. stock indices make new all-time highs it would be a bullish signal.
Action of the next strongest index (IXIC) on 01/24/25 could be important.
The hourly IXIC chart courtesy of Trading View illustrates its Elliott wave structure since its all-time high in December 2024.
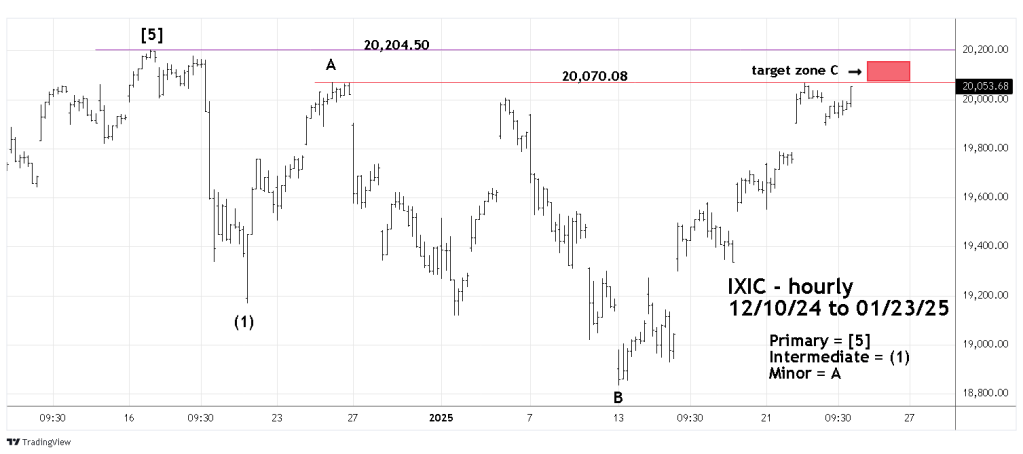
IXIC could be forming the same Elliott wave pattern as the Dow Jones Industrial Average illustrated in this websites 01/22/25 blog.
IXIC could have an intermediate degree wave (1) decline retraced by an Elliott wave – Expanding Flat correction.
In an Expanding Flat – wave – “C” needs to exceed the termination point of wave “A”.
The termination point of the presumed Minor wave “A” is 20,070.08. The IXIC high on 01/23/25 was 20,068.52.
If on 01/24/25 IXIC exceeds 20,070.08 and stays below its all-time high of 20,204.50 an important secondary peak could be reached.
