This websites prior blog noted that the S&P 500 (SPX) had powerful resistance in the area of the declining trendline connecting the12/26/24 and 01/06/25 peaks.
Trading View has a stock index called SPX 500 symbol SPX500 which tracks the movements of the S&P 500 futures with equivalent price levels to the SPX. This allows you to see what SPX could be trading outside of its daily session.
The following SPX500 hourly chart is courtesy of Trading View.
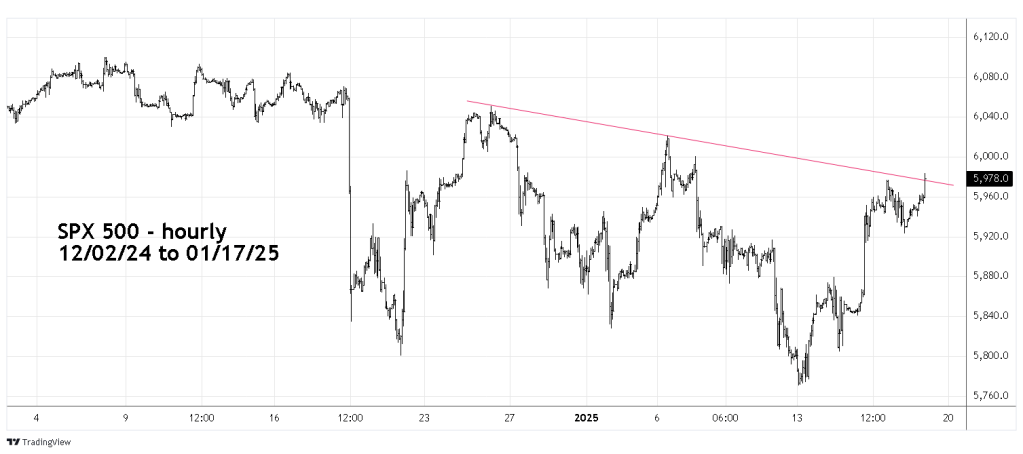
As of 8:51 – AM – ET on 01/17/25 the SPX500 is trading above the declining trendline and above the Fibonacci resistance levels noted in the 01/16/25 blog.
The SPX will probably open the 01/17/25 session above important resistance. If so the opening price is likely to be low for the daily session.
