There’s a high probability that the October 2022 to December 2024 – S&P 500 (SPX) bull market is a completed Elliott wave extended Impulse pattern.
The weekly SPX chart courtesy of Trading View updates the long- term action.
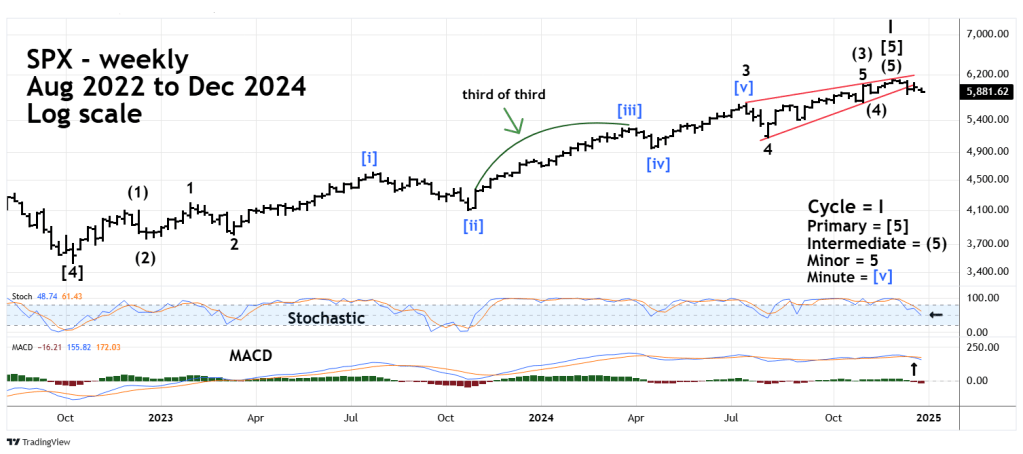
After the October 2022 bottom the SPX formed a series of “one’s and two’s” This pattern is usually the prelude to very dynamic price movement. The movement from October 2022 to March 2023 was the set-up phase for the subsequent powerful rally.
The longest and strongest part of an extended Elliott Impulse wave usually occurs in the center of the structure. This is exactly what happened during October 2022 to December 2024 price movement. Please note the rally segment from October 2023 to March 2024 which is longest in time and greatest in percentage gain.
Finishing the larger structure was a series of “four’s and five’s”. This pattern corresponds to the series of “one’s and two’s”. The choppiness from August 2024 to December 2024 is the type of action expected in the late phase of an extended Impulse pattern.
From the aspect of standard Technical price patterns, the movement from July 2024 to December 2024 was a bearish rising wedge. The subsequent decline breaking below the rising lower trendline is powerful evidence that a major peak may have been made in December 2024.
Action from the weekly Stochastic and MACD support the theory that a major SPX top may have been made in December 2024. Stochastic has been trending lower for weeks, and both lines are deep in the neutral zone. MACD recently had a bearish lines cross.
If the SPX downturn continues it could reach the 5,100 area sometime in January 2025.
Happy New Year!
