Comparison of the S&P 500 (SPX) and Russell 2000 (RUT) could provide clues to what may happen in 2025.
The weekly SPX chart courtesy of Trading View illustrates the Elliott wave pattern from the October 2022 bottom.

The post October 2022 bull market is a textbook extended Elliott wave Impulse pattern. This structure begins with a series of wave “one’s” and “two’s”. In this case there’s a series of three “one’s” and “two’s”. Subsequently there’s usually a long steady wave with only tiny corrections. These long and powerful waves are referred to as a third of a third. The final section of an extended Impulse wave is a series of “four’s” and “five’s”.
Extension of waves can happen at any time and cannot be predicted. For example, the recent move up that began on 11/04/24 could be the first wave of a still developing larger five wave pattern. For this scenario to develop there would need to be a multi-day partial retracement of the post 11/04/24 rally followed by another rally to new highs.
There’s a possibility an extension of the post 11/04/24 rally could occur. This scenario will be examined in future blogs.
The weekly RUT chart shows its Elliott wave count from its all-time high made in November 2021.
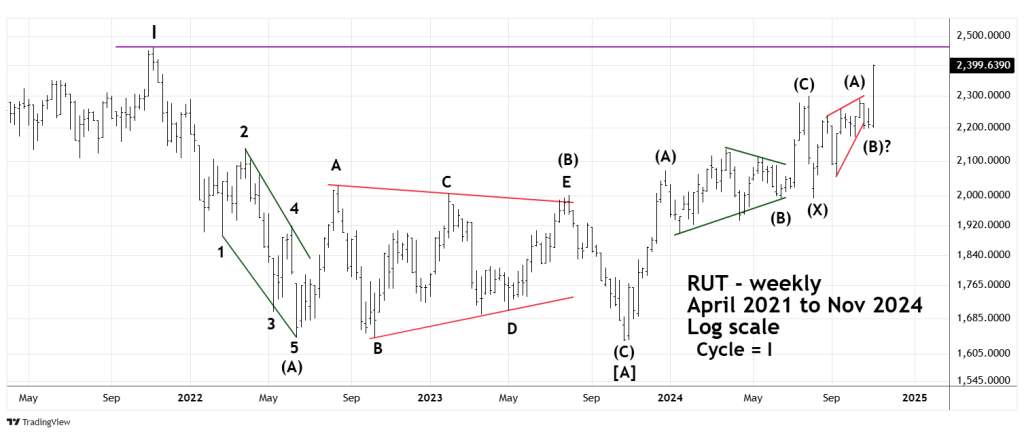
Please note the choppiness of the RUT post October 2023 rally with the smooth steady progress of the SPX bull market after October 2022.
The choppy nature of the RUT rally implies its correcting the downward progress from November 2021 to October 2023 bear market. If so there’s a good chance the entire post October 2023 rally could ultimately be completely retraced.
The Elliott wave action during the next two weeks could be very important.
Termination of the bull market or an extension of the rally into 2025? A break below the 11/04/24 bottom could provide the answer.
