The 10/24/24 blog “Russell 2000 – Impulse Down” illustrated that the Russell 2000 (RUT) could rally into a target zone between 2,235 and 2,255. The 5 – minute RUT chart courtesy of Trading View shows what happened.
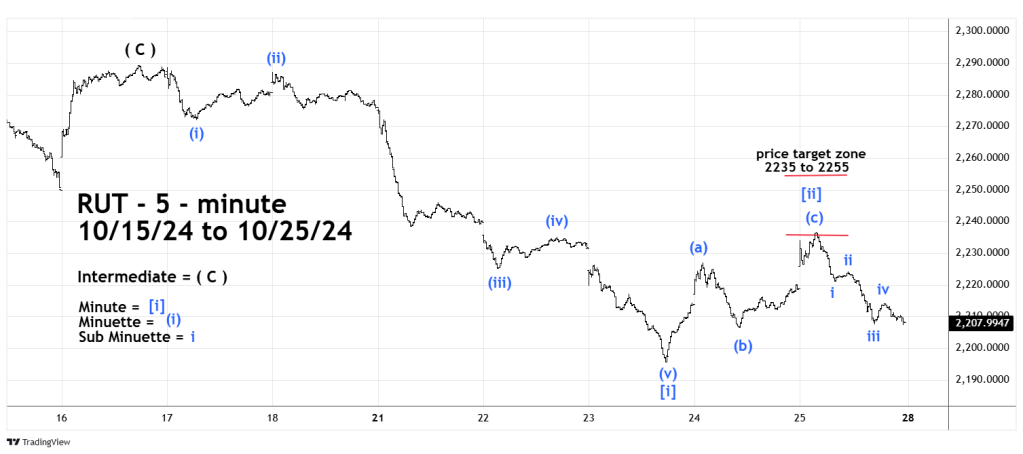
The rally after the 10/23/24 bottom is a clear Elliott wave – Single Zigzag pattern which is presumably correcting the extended five wave decline from the 10/16/24 peak.
The RUT high on 10/25/24 was at 2,236 just inside the target zone and a 46% retracement of the prior five wave decline. This is shallow for a presumed wave “two” retracement which typically retrace about 61% of a post primary peak decline.
Also, after the 10/25/24 peak another five-wave decline appears to be developing.
If Minute wave [ii] is complete the shallow retracement is signaling a rapid and sharp decline could be developing.
How rapid and sharp? The one – hour RUT chart illustrates what could happen.

The 10/24/24 blog illustrated that an Elliott wave – Ending Diagonal Triangle (EDT) probably completed at the 10/16/24 top. After completion of an EDT there’s usually a rapid retracement back to the EDT point of origin. In this case the 08/05/24 bottom.
The week of 10/28/24 to 11/01/24 could be very bearish for Russell 2000.
