The Russell 2000 (RUT) – small cap stock index could be in the early part of a rapid move down to the 08/05/24 bottom.
The 10/17/24 blog “Mixed Signals – Part Two” illustrated that RUT may have completed an Elliott wave – Ending Diagonal Triangle (EDT). The daily RUT chart courtesy of Trading View updates the action.
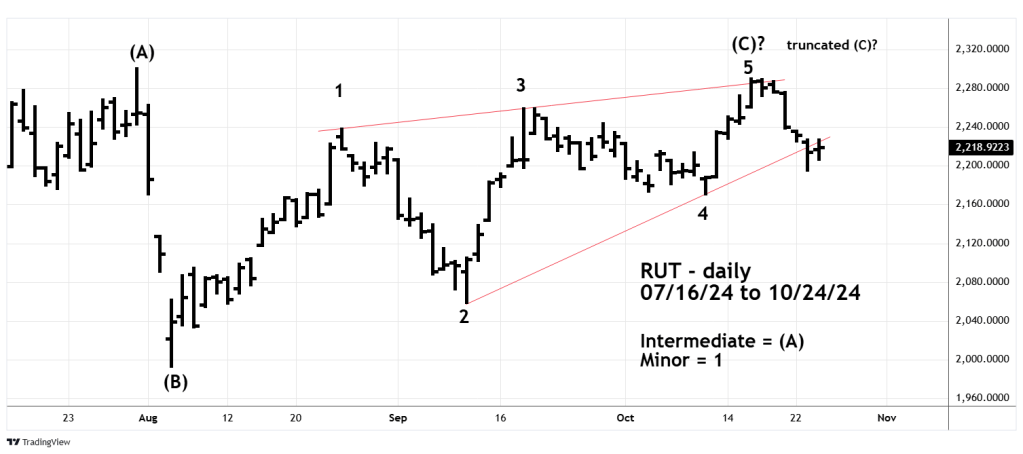
Ending Diagonal Triangles are termination patterns of the larger trend. After completion they usually retrace at least back to the EDT point of origin. In this case it’s the 08/05/24 mini crash bottom. The immediate turn after an EDT is typically rapid, RUT could be in the area of the 08/05/24 bottom by 11/01/24 or 11/04/24.
From an Elliott wave perspective there’s another potentially bearish message. About 85 to 90 percent of the time the fifth wave of a motive pattern exceeds the termination point of the third wave. In corrective patterns about 85 to 90 percent of the time wave “C” exceeds the termination point of wave “A”.
The failure to exceed a prior waves termination point is called “Truncation” when this phenomenon occurs in a rising trend it usually signals the next downtrend could be severe. Truncated waves cannot be forecasted, and confirmation usually happens well after the truncated turn. For the presumed Intermediate wave ( C ) peak made on 10/16/24 a move below the 08/05/24 bottom would confirm the truncated wave.
The Ending Diagonal Triangle and the potential truncated wave (C ) is a double bearish signal.
The one – hour RUT chart zooms in on the intraday action.
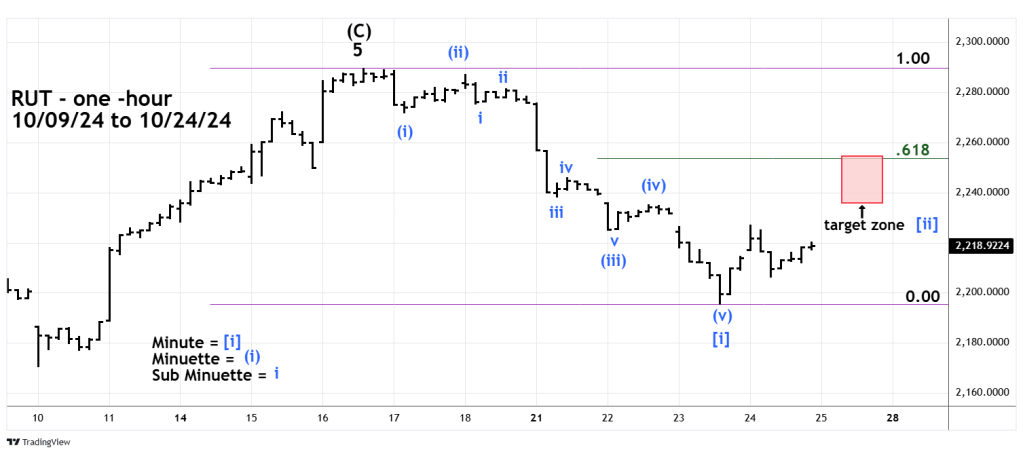
The 10/16/24 to 10/23/24 decline has taken the form of a clear extended Elliott Impulse wave which could be the first wave down of a larger developing bear move.
If the post 10/23/24 rally is not complete it could peak in the area of 2,235 to 2,255.
