The 10/17/24 blog “Mixed Signals – Part – Two” illustrated that the Russell 2000 (RUT) may have completed an Elliott wave – Ending Diagonal Triangle” from its 08/05/24 bottom. Amazingly one of the three main U.S. stock indices and a major stock may have also completed the same pattern.
The 4 – hour Nasdaq Composite (IXIC) chart courtesy of Trading View examines its recent action.
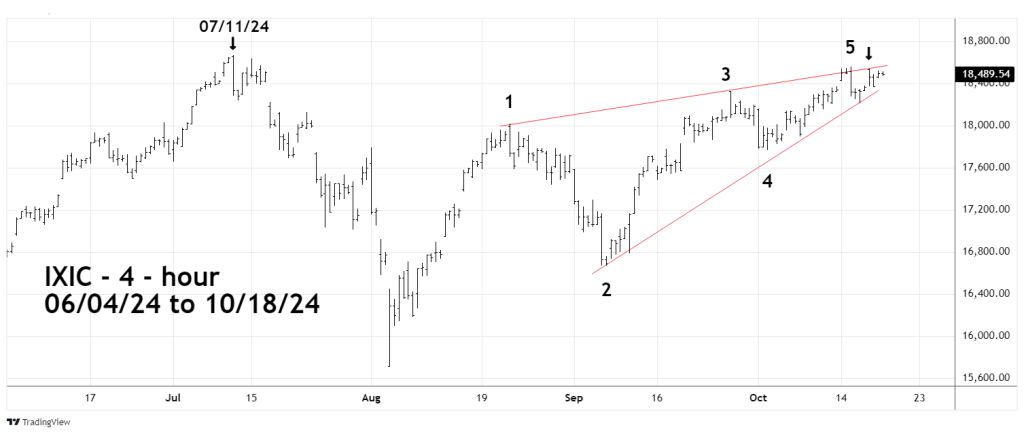
The presumed IXIC – Ending Diagonal Triangle (EDT) began at the 08/05/24 bottom. This is not an ideal pattern as the presumed wave “4” does not touch the lower rising trendline. Also note that on 10/17/24 IXIC stayed below the upper rising trendline. It’s possible IXIC may have completed its Ending Diagonal Triangle on 10/15/24.
The 4 – hour Apple Inc (AAPL) chart illustrates its rally from the 08/05/24 bottom.
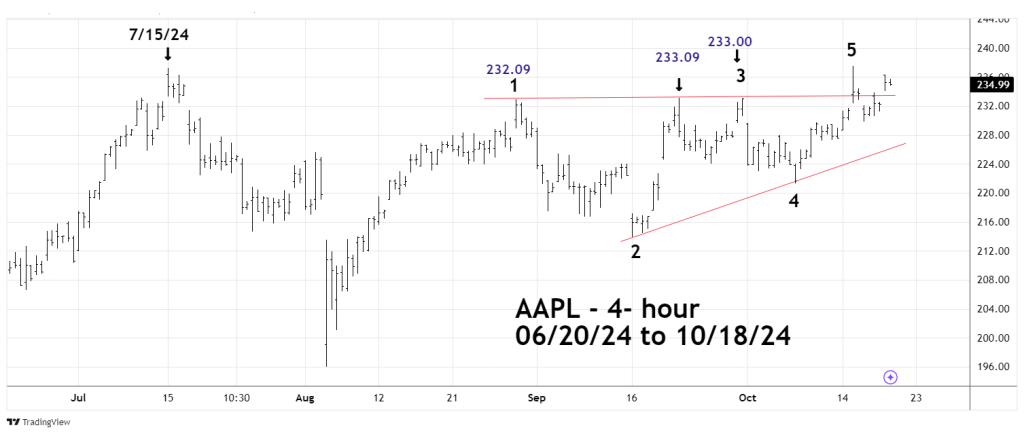
The presumed wave “3” is marginally above the presumed wave “1” creating a shallow rising trendline. Also note the action after the presumed “5” top. Price rallied above the upper rising trendline. Typically, after the termination of a rising EDT price stays below the rising upper trendline.
RUT, IXIC, and AAPL – EDT’s are also forming double peaks vs. their prior respective 2024 highs.
What’s interesting is that all of the prior 2024 highs were made at different dates.
RUT first 2024 peak was on 08/01/24.
IXIC first peak was on 07/11/24.
AAPL first 2024 peak on 07/15/24.
After completion of an Ending Diagonal Triangle there’s typically a rapid move back to the triangles point of origin. In this case the bottoms formed on 08/05/24.
