Sentiment readings for U.S. stocks late September 2024 are shockingly bearish.
The CBOE Volatility Index (VIX) sometimes called the fear index is very effective in discovering S&P 500 (SPX) bottoms. Sharp spikes up in the VIX usually correspond to significant SPX bottoms. You may think that VIX lows correspond to SPX peaks. This is not the case; SPX tops occur after the VIX has made a higher bottom.
The VIX is calculated by Put and Call option activity. After persistent SPX rallies some traders increase buying of PUT options as a hedge against a stock market decline. The increase in hedging causes the VIX to have higher bottoms.
The daily SPX and VIX chart courtesy of Trading View illustrates what’s been happening since May 2024.
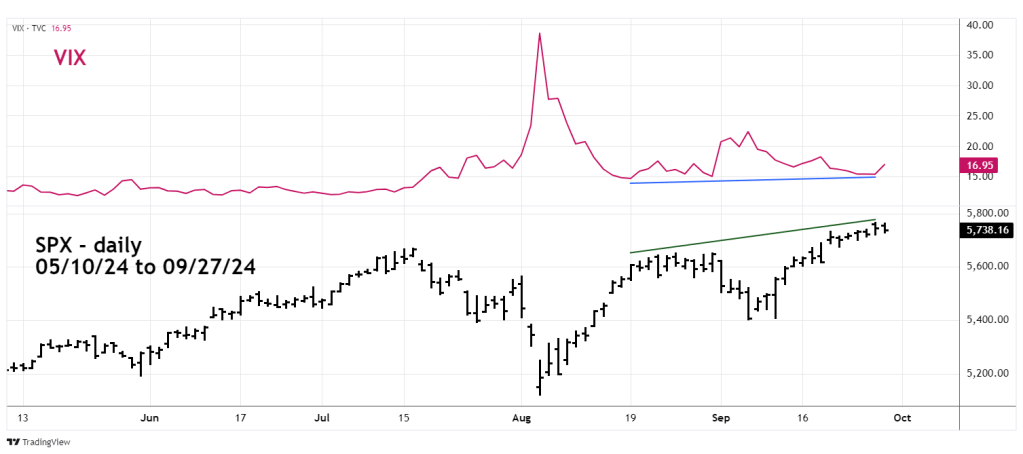
The early August SPX mini-crash triggered a huge VIX spike after which the VIX declined and bottomed in mid – August. Since then, VIX has trended higher. At the 09/26/24 SPX all-time high VIX had a higher bottom.
At major SPX peaks this phenomenon occurs just prior to a multi-month decline. The September VIX/SPX divergence is third since the start of 2024. The other two signals in March and July were just prior to multi-week declines. Normally there’s only one VIX/SPX bearish divergence prior to a multi-month SPX drop. The manic persistence of the 2024 stock bull market has resulted in three signals.
The daily SPX chart illustrates Market Vane Bullish Consensus readings since the SPX October 2023 bottom.

The Bullish Consensus study, tracks the buy and sell recommendations of leading market analysts and commodity trading advisers.
For the SPX readings over 65% occur near major tops, major bottoms correspond to readings below 35%.
Significant market turns can come on an extreme reading or on a divergence. The highest Market Vane reading so far happened in July 2024 at 73%. At the higher SPX top late September, the reading is 70% a potential bearish divergence.
The data from Market Vane and the VIX/SPX divergence indicate that sentiment for U.S. stocks is at a level that implies a significant decline. The momentum evidence illustrated in this websites prior blog is also very bearish.
The bullish move of U.S. stocks in 2024 has been extraordinary. There have been multiple bearish sentiment and momentum signals, yet the bulls overcome them. It seems like the uptrend could continue forever.
Nothing ever lasts forever.
