The 08/17/24 blog “Super Bearish Message from Gold and Silver” illustrated that Gold (XAUUSD) could be forming the final wave of an Elliott wave – Ending Diagonal Triangle (EDT). Typically, EDT’s fifth wave has a throw over of the trendline connecting the termination points of the first and third wave. This occurred on 08/20/24 one trading day after a Full Moon on 08/19/24. Usually after a throwover in a rising EDT, price quickly moves below the trendline and stays below the line.
On 08/23/24 Gold rallied slightly above the trendline. In the short-term Gold could have more upside potential.
There are always alternate Elliott wave counts. The monthly Gold chart courtesy of Trading View shows one of the long-term alternate wave counts.

The 08/17/24 blog illustrated Gold’s mid-November 2023 as a possible Minor wave “4” of a Horizontal Triangle.
The alternate wave count shows the bottom made in October 2023 as a presumed Intermediate wave (2).
The daily Gold chart focuses on the wave count from the October 2023 bottom.
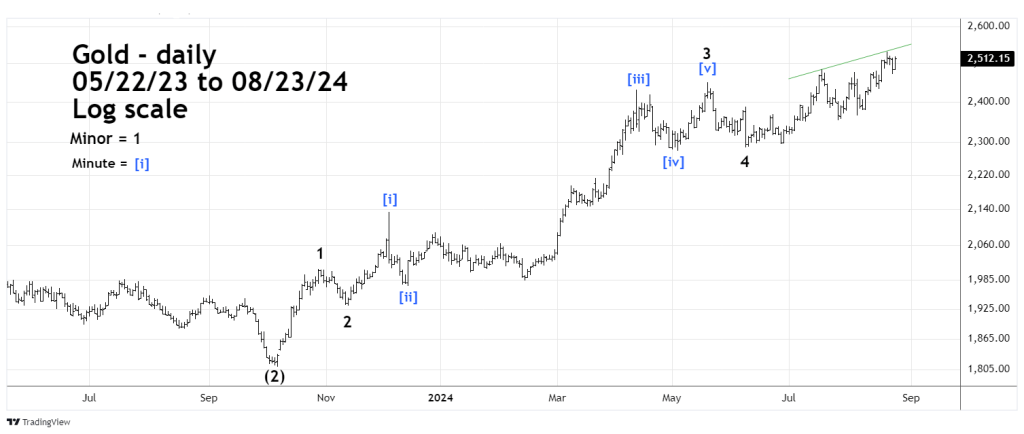
In this configuration the mid- November 2023 bottom is a presumed Minor wave “2” of a developing extended Impulse wave.
The next important point on the chart is the 06/07/24 bottom labeled Minor wave “4”. The action after 06/07/24 is unclear. It’s possible Minor wave “5” is forming an Ending Diagonal Triangle or another configuration.
If Gold can move above its current all-time high set on 08/20/24 the rally may not last very long or go very high.
The most recent Commitment of Traders report shows that Gold Commercials are still holding their largest short position since the March 2022 Gold top. Also, Silver continues to have a significant bearish divergence relative to Gold.
Longer term evidence suggests Gold could be in the area of a significant top.
