Recent action from Gold (XAUUSD) and Silver (XAGUSD) suggests they both may have begun multi – week declines.
The 06/30/24 blog “Gold – Point & Figure Analysis – 06/28/24” illustrated that Gold had important support at 2,277.43. Subsequently Gold rallied and made a new all-time high.
The weekly Gold (XAUUSD) chart courtesy of Trading View shows what happened.
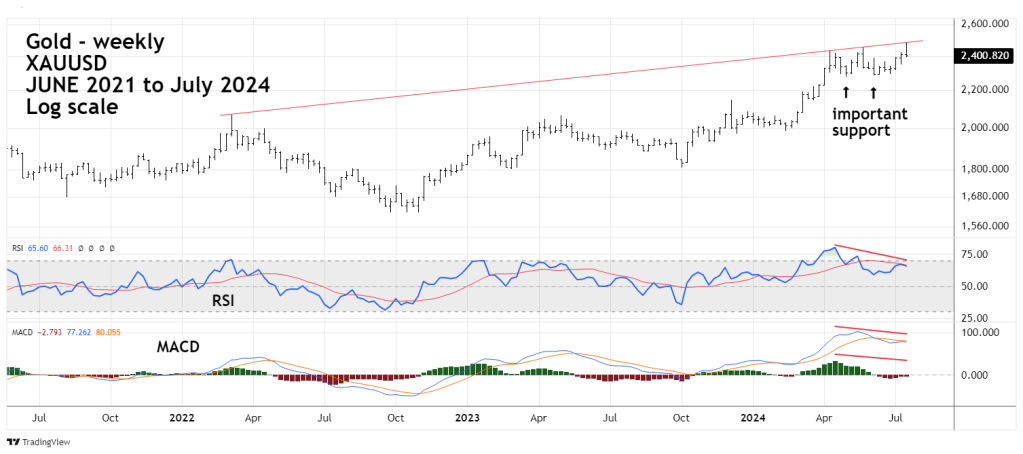
Gold hit a rising trendline from the 2022 peak and then moved down decisively. Weekly RSI has a significant double bearish divergence. MACD lines and Histogram also have significant bearish divergences.
Gold has a good chance to reach at least important support in the 2,270 to 2,290 area.
The action of Silver during the prior week also suggests this metal could be in a near-term decline.
The monthly Gold and Silver chart shows their long – term relationship.
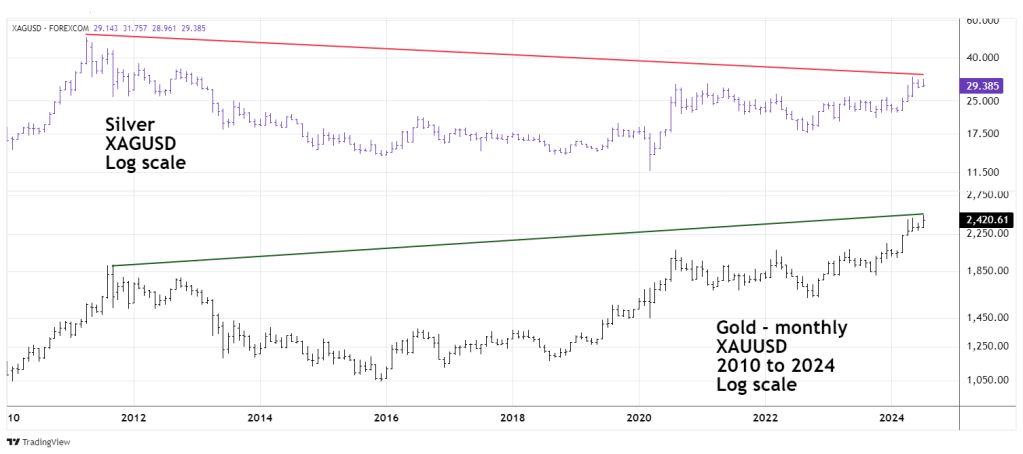
For more than a decade Silver has underperformed Gold on the upside. That underperformance continues as illustrated in the weekly Silver (XAGUSD) chart.
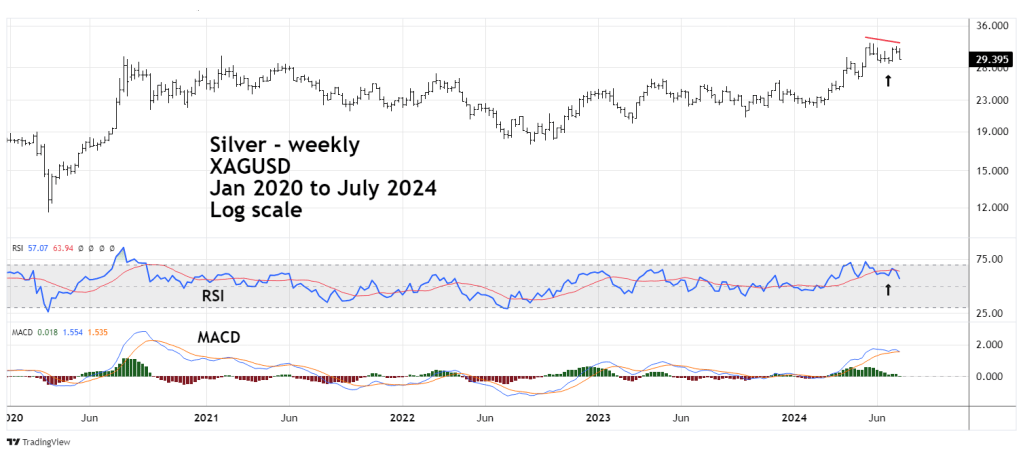
Last week Silver failed to confirm Golds – 2024 rally high. Additionally note the position of the weekly RSI. While Silver is holding above the recent decline low of three weeks ago, weekly RSI is below its respective reading made at the same time. Sometimes this phenomenon can be predictive. In this case, Silver could soon be trading below its most recent bottom.
Momentum evidence suggest Gold and Silver could be in multi-week declines.
