Since 1998 there have been seven significant S&P 500 (SPX) tops. What happened after these peaks could be a guide for the near future.
Each of the seven peaks subsequently had declines greater than 7%.
They are as follows:
1998 – 07/20/98 to 10/08/98 – decline 22.50%.
1999 – 07/19/99 to 10/18/99 – decline 13.40%.
2005 – 07/28/05 to 10/03/05 – decline 7.48%.
2007 – 07/16/07 to 08/16/07 – decline 11.80%.
2011 – 07/07/11 to 10/04/11 – decline 20.80%.
2015 – 07/20/15 to 08/24/15 – decline 12.50%.
2023 – 07/27/23 to 10/27/23 – decline 11.00%.
Of the seven, five had declines into October. All of the declines had greater than 3% drops into August.
Five of the seven post July drops are illustrated in the daily Logarithmic charts courtesy of Trading View.
The first is from 1998. Daily RSI and MACD indicators are shown which could be used as a guide if the July 2024 drop continues into August or October.
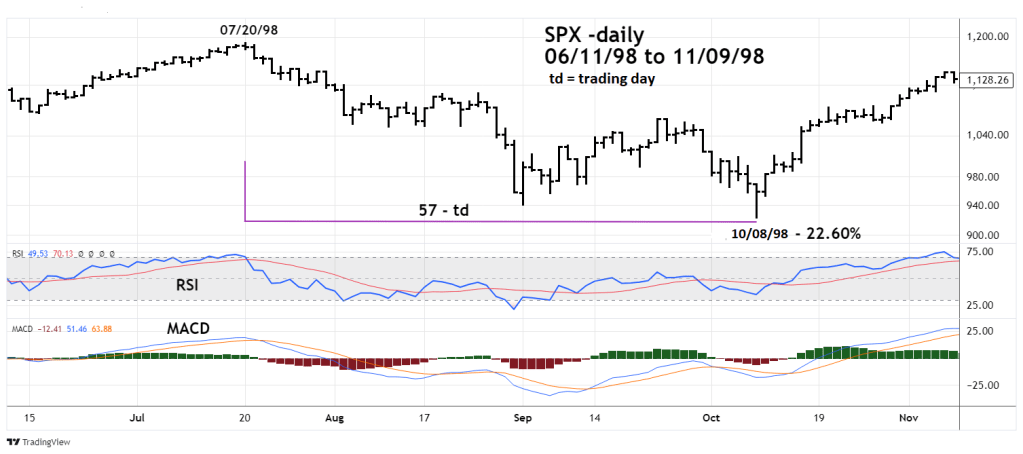
Note that the peak occurred on 07/20/98, the July 2024 SPX peak so far is 07/16/24. Also note the decline into August 1998.
The next chart shows the action in 1999.
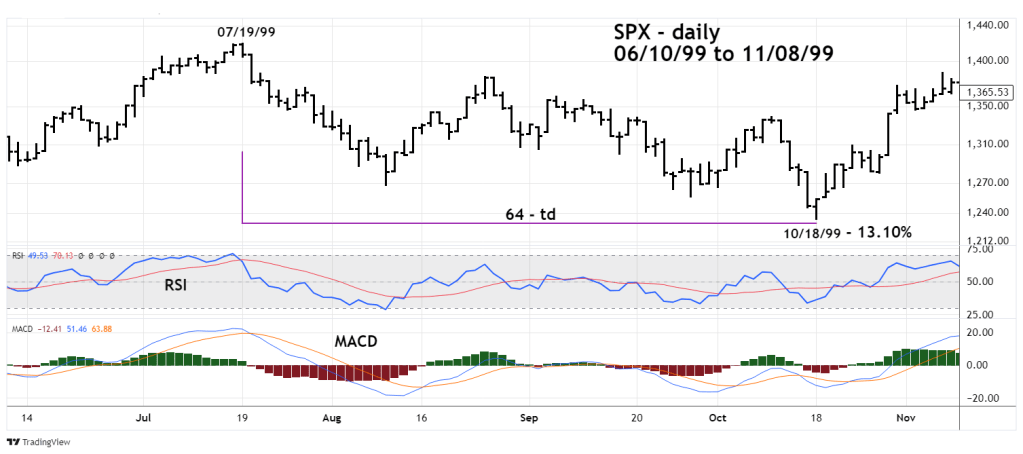
One year after the 1998 bear market there was a correction within the post October 1998 bull market. Note the date of the peak 07/19/99. Again, note the decline into August 1999.
Next up illustrates the 2011 mini bear market.

This July peak was marginally below the 05/02/11 top – an example of a seasonal U.S. stock market peak in May.
In this case the drop into August was large, more than 18%.
The next chart shows what happened in 2015.

Again, there’s a marginally lower top in July vs. the seasonal peak made in May. What happened after the 07/20/15 top was the August 2015 mini – crash.
The final daily chart shows the action in 2023.

In 1998 there was a July to October bear phase. One year later there was another July to October bear phase. Perhaps the 2023 July to October bear phase could be followed by a 2024 July to October bear phase.
The monthly Logarithmic chart illustrates a possible long-term Fibonacci time cycle.
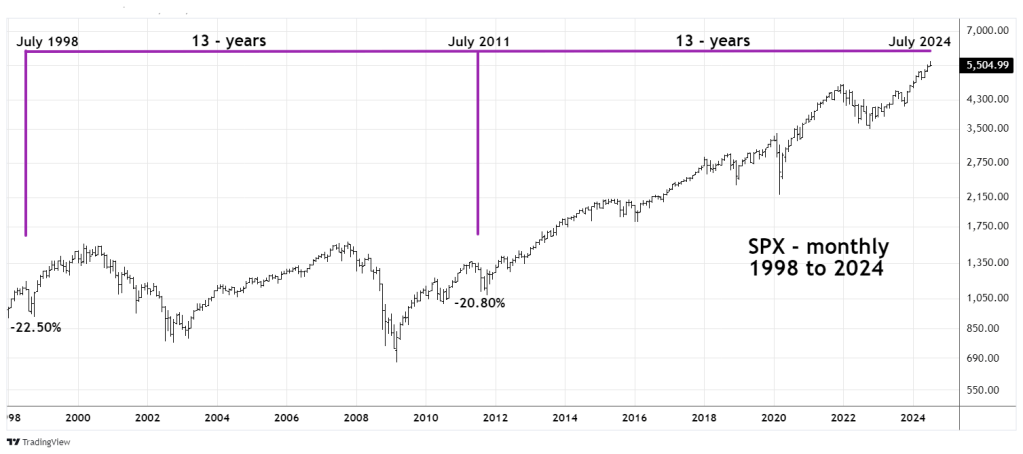
The two largest July to October declines happened in 1998 – down 22.50% and 2011 – down 20.80%. The time between these to bear markets was 13 – Fibonacci years. Adding 13 – years to 2011 targets 2024.
It’s possible the SPX could fall more than 20% July to October 2024.
