The most likely Elliott wave count for the S&P 500 (SPX) since the January 2022 peak is that an Expanding Flat correction could be forming. In this count the first wave “A” is a corrective pattern. The second wave “B” is also a corrective pattern and exceeds the point of origin of the first wave. The final wave “C” is a motive pattern that exceeds the termination point of the first wave.
This wave count is still a possibility, however recent action has increased the probability of an alternate wave count.
The first weekly SPX chart courtesy of Trading View illustrates the presumed developing Expanding Flat.
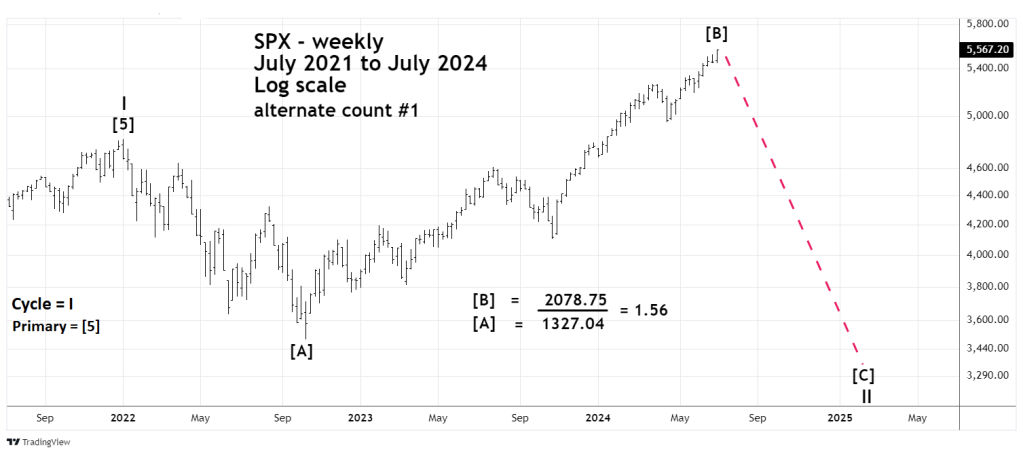
Note that the presumed Primary wave [A], the January to October 2022 decline has the choppy look of a corrective pattern. The first half of the rally after October 2022 has a corrective choppy look and then smooths out.
The most common Fibonacci relationship between waves “B” and “A” in Expanding Flats is the inverse Fibonacci ratio of 1.236. The next most common Fibonacci relationship is 1.382. The inverse ratio of 1.50 is not common. The inverse ratio of 1.618 is rare. As of 07/05/24 the Fibonacci relationship of Primary wave [B] to Primary wave [A] was 1.56.
This Fibonacci relationship and the smoothness of the SPX rally since May 2023 increases the probability that an alternate wave count could be developing.
The monthly SPX chart shows the alternate Elliott wave count.
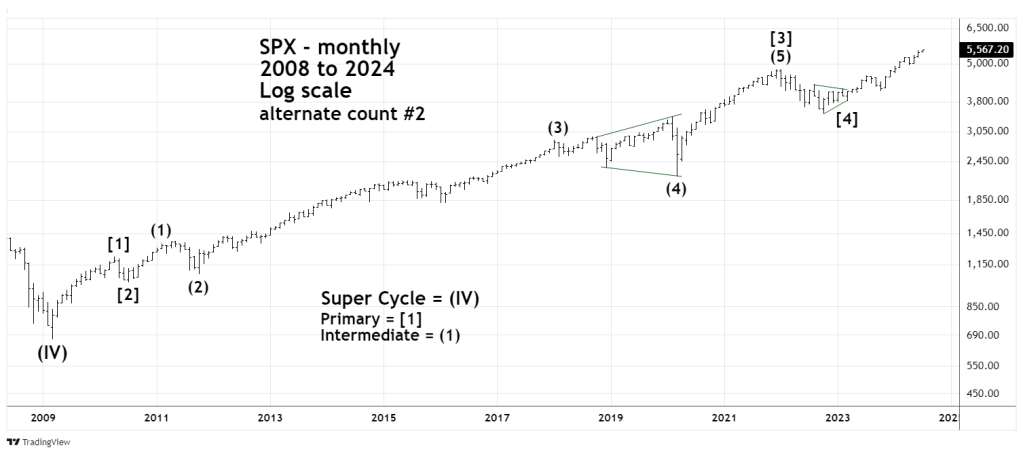
It’s possible that the extended Impulse wave from the March 2009 bottom is still forming. If so the SPX could currently be in the final stage of that development.
One interesting aspect of this formation is the movement from January 2018 to March 2020 labeled Intermediate wave (4) – a rare Expanding Horizontal Triangle.
The next weekly SPX chart zooms in on the action after the January 2022 peak.
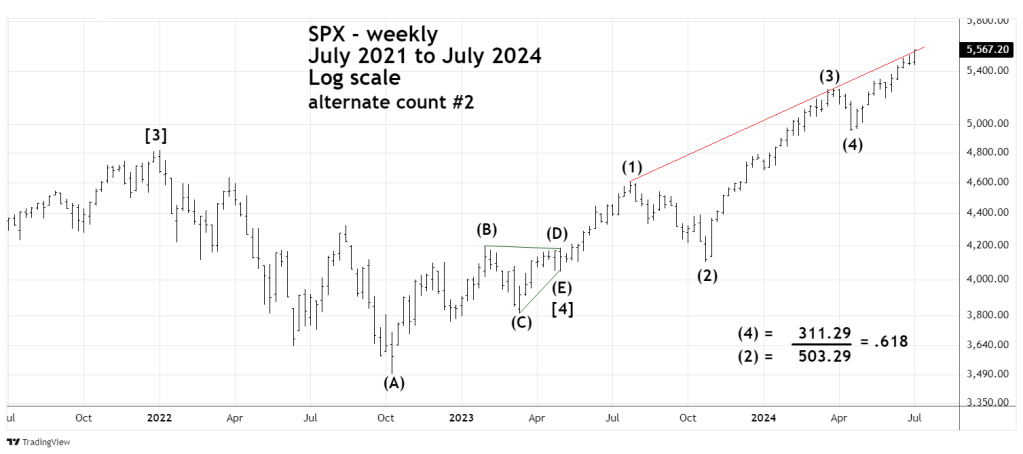
The movement from 01/04/22 to 05/04/23 could be an Elliott wave – Contracting Horizontal Triangle. The subsequent move up to the present is a five-wave impulse pattern. Please note the smoothness of the sub wave (1), (3), and (5), which is a characteristic of impulse waves.
Within Impulse waves there’s usually a Fibonacci relationship between waves “two” and “four”. In this case the presumed Intermediate wave (4) was 311.29 points. Intermediate wave (2) was 503.29 points, a perfect Fibonacci .618 relationship.
At the SPX high of 5,570.33 there are not any long or short-term Fibonacci resistance points. In this case they may not be needed. On the Log scale chart, the rising trendline connecting the July 2023 and March 2024 peaks could suffice as resistance.
On the long term, both alternate Elliott wave counts have the same message, a deep and sustained decline could be imminent. The time of a possible bear phase could be seven to twelve months. In terms of price, a retracement back to at least the October 2022 bottom is possible.
On the short-term the movement from the 04/19/24 bottom appears to be an extended Impulse pattern. A move below the 04/19/24 bottom labeled Intermediate wave (4) could be an important clue to a larger developing movement.
