The sharp Rusell 2000 (RUT) drop 06/12/24 to 06/14/24 could be the prelude to a larger decline. Volume Profile analysis supports this theory.
The Volume Profile method places volume on a vertical axis matching volume with price levels. This helps to define support/resistance areas. The widest part of Volume Profile is called “Point of Control” (POC) which identifies the strongest potential support/resistance.
The Russell 2000 index does not record volume. The iShares Russell 2000 – ETF (IWM) is an effective substitute for Volume Profile analysis.
The daily IWM chart courtesy of Trading View illustrates its Volume Profile.

Note that on 06/14/24 there was a break below POC, this explains the importance of the 15 – minute RUT chart illustrated in the prior blog “The Incredible Shrinking U.S. Stock Market. Normally after reaching potentially strong support a rally should develop, what happened was a narrow bracket. This indicates bulls are being overwhelmed by continued selling.
The bears still have a lot of work before they can achieve a decisive victory. Note below POC there are layers of secondary POC.
The next daily IWM chart examines the larger rally from 10/27/23 to 05/28/24.
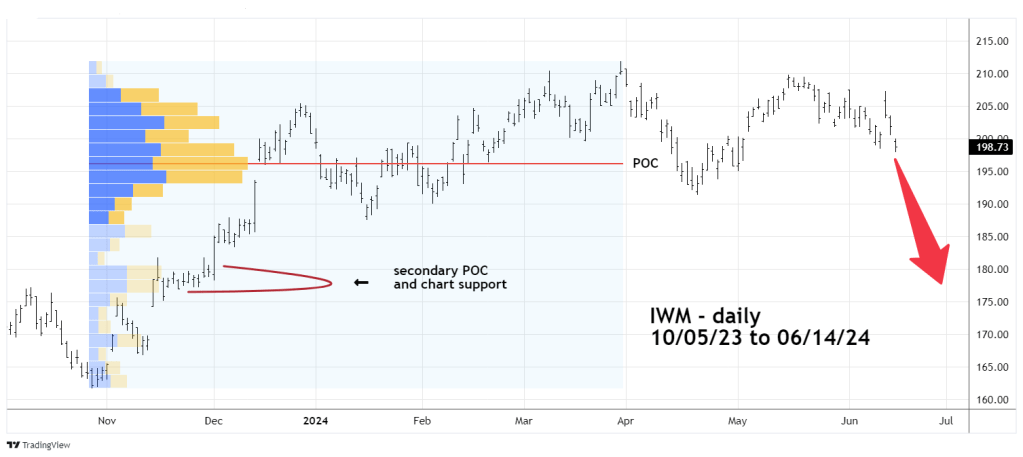
The larger POC is in the same area as the smaller scale secondary POC – this is where the bulls could stage a counterattack.
If the bears can punch through this redoubt, it could trigger a plunge to late November 2023 chart support.
Traders initiated a 100% short position of RUT non-leveraged funds at the open of the 05/23/24 session. Continue holding short.
