During stock bull markets indices usually trend together. Divergences of indices within a bull trend could be the prelude to a significant decline.
The monthly Russell 2000 (RUT) and S&P 500 (SPX) chart courtesy of Trading View shows their relationship during the secular bull market 2009 to 2021.
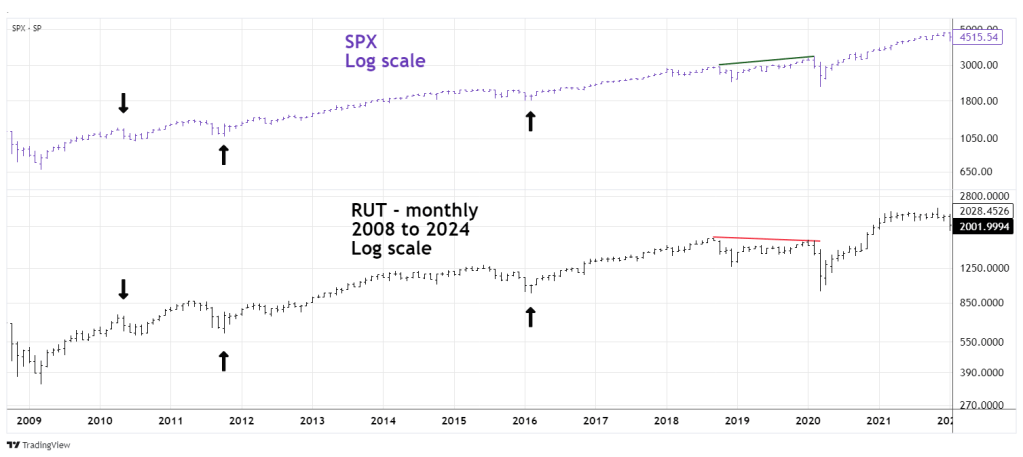
For most of the time both indices trended together. When RUT made a new high it corresponded with the SPX. They also made correction bottoms at the same time. The only significant divergence was prior to the 2020 crash.
The weekly RUT and SPX chart examines their activity since late 2021.

After November 2021 the RUT has been significantly weaker than the SPX. The SPX made a significant bottom in October 2022. The RUT bottom didn’t occur until October 2023. After October 2023 the SPX was able to exceed its prior all-time high made in January 2022. RUT was only able to retrace about 60% of its November 2021 to October 2023 bear market.
The daily RUT and SPX chart focuses on their action after 03/28/24.
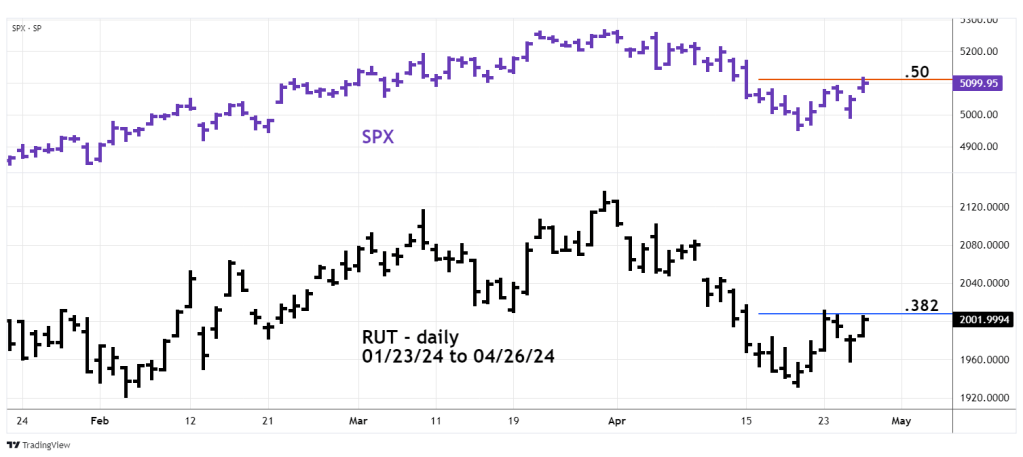
Both indices made post October 2023 rally highs on 03/28/24. Subsequently the SPX fell 6%, the RUT decline was 9.6%. The SPX post 04/19/24 rally has so far retraced a little more than 50% of its 03/28/24 to 04/19/24 decline. The RUT has only retraced about 38% of its drop into 04/19/24.
The 30 – minute RUT and SPX chart zooms in on the rally after 04/19/24.
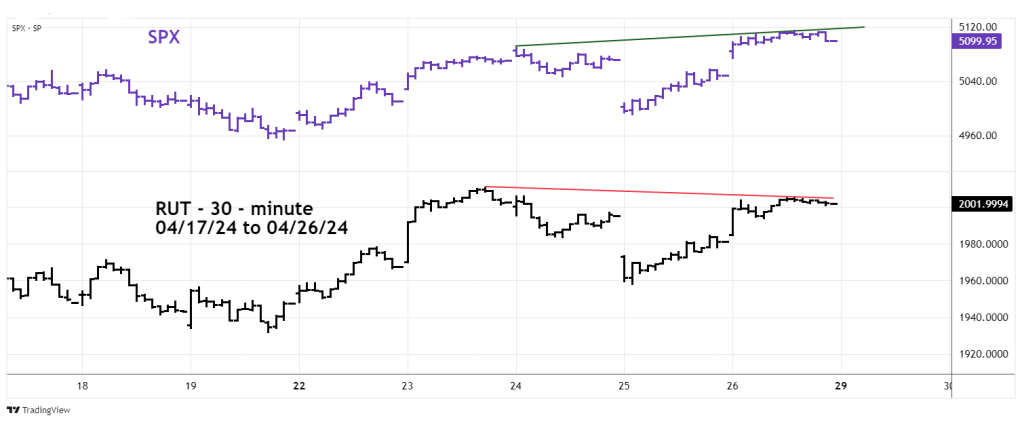
The SPX on 04/26/24 was able to exceed its peak made on 04/23/24. The RUT failed to move above its 04/23/24 high.
On three different time scales RUT is weaker than the SPX.
Long term this action implies U.S. stocks could be in a bear market for most of 2024. Short term focus is on the 04/19/24 bottoms. If the SPX break below it 04/19/24 low it could soon reach the area of its January 2024 correction. A break of the RUT 04/19/24 bottom could trigger a move down to its consolidation zone made in late November 2023.
