Weekly momentum indicators imply more downside action for the S&P 500 (SPX) and the Russell 2000 (RUT).
The weekly SPX chart courtesy of BigCharts.com illustrates three momentum oscillators.

The lower line for weekly Slow Stochastic has only reached 30%. The oversold zone begins at 20%.
Weekly RSI is in the upper part of the neutral zone at 58%. The RSI oversold zone begins at 30%.
The weekly MACD very recently had bearish lines cross. This is the most bearish signal. It implies the SPX could still be in the early phase of a multi month decline.
This site’s 04/17/24 blog illustrated the SPX target zone is in the area of its December 2023 to January decline. If the SPX reaches this zone soon, it may only provide short term support within a much larger decline.
The next weekly chart shows RUT momentum.
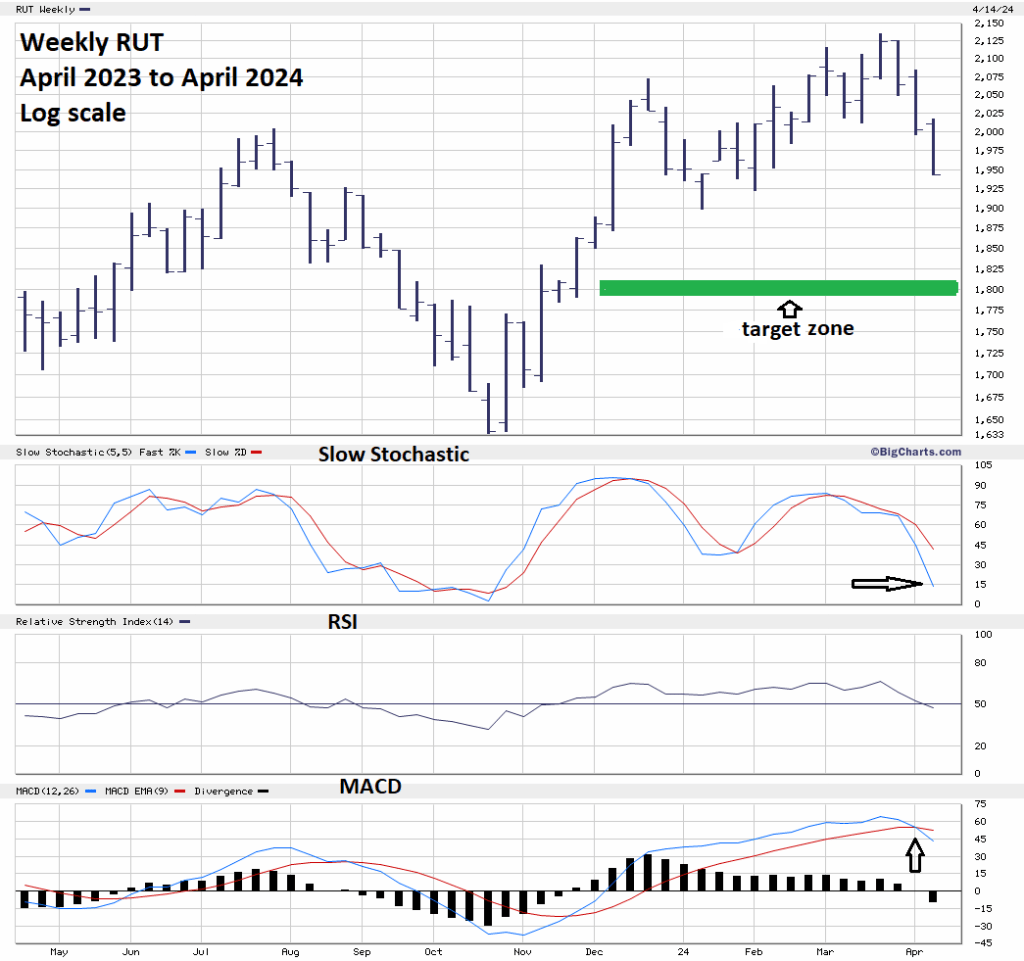
The only significant difference is that RUT lower Slow Stochastic line has reached the oversold zone.
If possible SPX and RUT could reach their 2022 bottoms sometime in late 2024 or early 2025.
