What happens in April could determine the course of U.S. stocks for the remainder of 2024.
Most perhaps all markets have seasonal tendencies. Sometimes the most powerful signals can occur when a market moves counter to its seasonal pattern.
The monthly 2007 to 2009 – S&P 500 (SPX) chart courtesy of Trading View illustrates a very important counter seasonal signal.
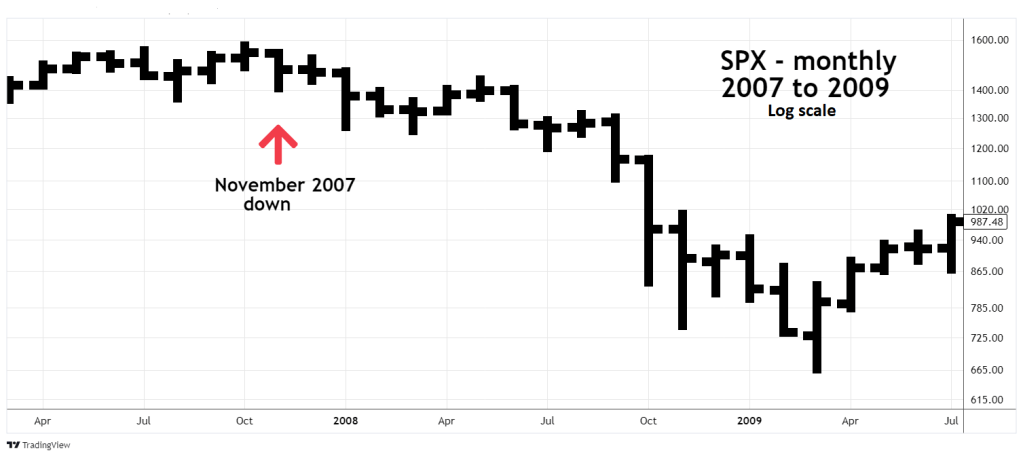
The SPX was in a bull market from October 2002 to October 2007. For several months prior to the October 2007 bull market top, momentum and sentiment indicators implied a major top could be forming. Yet the SPX persistently moved higher. Then in November 2007 something different happened.
The SPX ended the month of November down from its opening price on 11/01/07. Over several decades November has the greatest percentage of SPX closes above its opening price.
What happened in November 2007 combined with momentum and sentiment signals was a major warning. Subsequently U.S. stocks went into the largest bear market in forty years.
The next chart courtesy of EquityClock.com shows SPX seasonality over a twenty-year period.

Note that April has a strong bullish seasonal pattern.
The next monthly SPX chart shows the Trading View seasonality table.

The table covers ten- years of SPX action and illustrates the data in percentages. Note the high percentage of SPX bullishness during April.
The SPX bull move in the first quarter of 2024 is similar to what happened going into the October 2007 peak. Bearish momentum and sentiment signals with a persistently rising SPX.
As of 04/05/24 U.S. stock market bears are winning. If the bearish trend continues through April, it could be the beginning of a much larger decline.
