Elliott wave patterns along with Fibonacci and chart resistance, suggest the Russell 2000 (RUT) rally may have ended.
The weekly RUT chart courtesy of Trading View illustrates its long-term Elliott wave count.
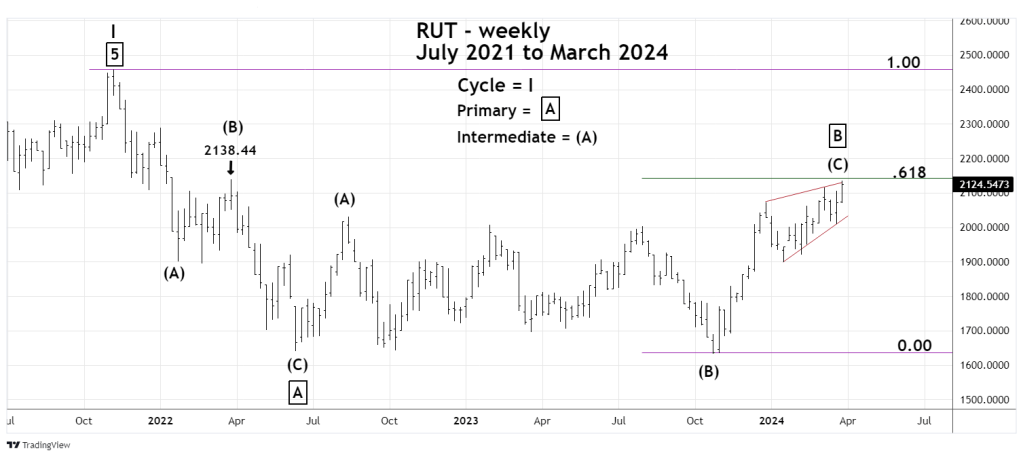
After its all-time high in mid-November 2021 there was a choppy bear phase that terminated in mid- June 2022. Subsequent to that bottom is an Elliott wave – Inverse Expanding Flat. This structure is composed of three sub waves in which the second wave exceeds the point of origin of the first wave. In this case Intermediate wave (B) which bottomed out in October 2023 and went marginally below the Intermediate wave (A) bottom of June 2022. The final wave subdivides into five waves – in this case Intermediate wave (C) is an Elliott wave – Ending Diagonal Triangle (EDT).
The RUT high on 03/28/24 was 2,135.45 which is just below the rally peak at 2,138.44 made almost two years before on 03/29/22. Just above this is 2,143.63 – a Fibonacci .618 retracement of the bear move from 2021 to 2023.
The bull run could die at or just below these resistance levels.
The daily RUT chart zooms in on the presumed Ending Diagonal Triangle.

The 03/06/24 blog “Russell 2000 – Elliott Wave Count” illustrated that the RUT could be forming an EDT from its 01/17/24 bottom. Subsequent action has invalidated that wave count.
EDT’s only form in the fifth wave position of motive patterns, and in the wave “C” part of corrective patterns. They are the termination phase of larger degree movements. They form a wedge pattern between two converging trendlines. Each of the EDT sub waves divide into three wave patterns. After conclusion of an EDT there’s usually a rapid retracement back to the patterns point of origin.
A potential flaw to the current EDT count is the presumed Minute wave “ i “ which has the look of an Impulse pattern. In fast markets this can happen to any of the three EDT motive waves.
Typically, an EDT will have a brief throw over of the trendline connection the termination points of the first and third waves. Note the throw over at the RUT high on 03/28/24.
The EDT’s high in proximity to two resistance points makes RUT a tempting target for downside bets.
Traders short 100% non – leveraged RUT funds at the open of the main trading session on 04/01/24. Use a move above RUT – 2,165 as a stop loss on half the position. Use a move above 2,185.00 as a stop loss on the remaining half.
