The 15 – minute SPX chart courtesy of Trading View updates the action.
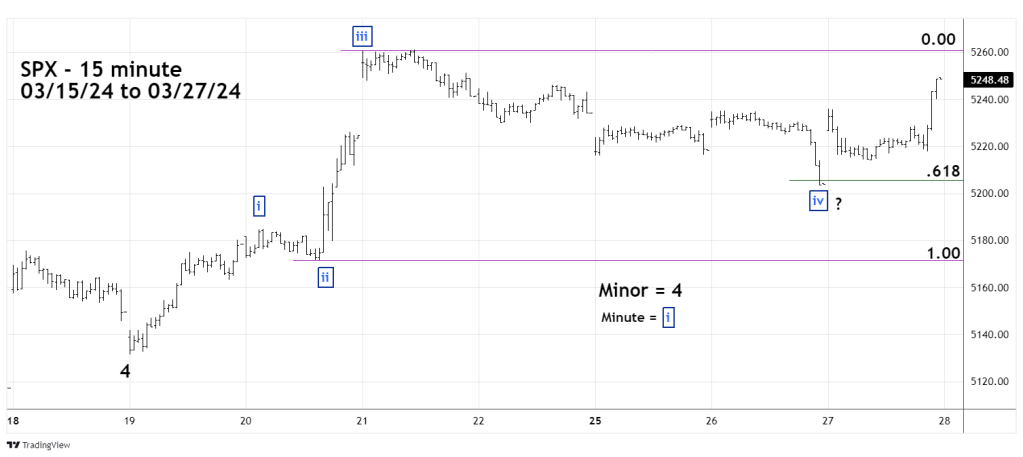
In Motive patterns the largest wave “four” Fibonacci retrace of wave “three” is usually .618. On 03/26/24 the SPX bottomed out just below this important support level. Also note the size of the presumed Minute wave “iv” is much larger in time and price than the presumed Minute wave “ii”. The deep retracement and size difference increases the chance that another wave count could be developing.
All U.S. markets are closed for the “Good Friday” holiday on 03/29/24.
That makes 03/28/24 the last trading day of the month and the end of the first quarter.
This implies there could be “window dressing” as some fund managers add high flying stocks to their portfolios. A potentially bullish factor.
If on 03/28/24 only one of the three main U.S. stock indices; SPX, Dow Jones Industrial Average, or the Nasdaq Composite makes a new all-time high, it could signal an important top.
