Shortly after R.N Elliott discovered the “Wave Theory” he also found that markets can occasionally have time movements measured by the Fibonacci sequence.
The Fibonacci sequence is as follows ( 1, 1, 2, 3, 5, 8, 13, 21, 34, 55, 89, 144, to infinity).
It’s possible the S&P 500 (SPX) could have a major Fibonacci time cycle turn in March 2024.
The monthly Dow Jones Industrial Average (DJI) courtesy of Trading View illustrates some of the Fibonacci time cycles discovered by R.N Elliott.

The colossal bear market from 1929 to 1932 lasted 3 – years which is a Fibonacci sequence number. The move down measured in months is also a Fibonacci sequence number – 34. Movements measured in Fibonacci years do not always match with movements measured in Fibonacci months.
The Bull market that began in July 1932 lasted a Fibonacci 5 – years but was 56 – months long. Close to, but not the Fibonacci sequence number of 55.
The subsequent bear market that began in March 1937 and ended in April 1942 was also a Fibonacci 5 -years long, but measure 61 – months, not a Fibonacci sequence number.
The monthly S&P 500 (SPX) chart shows the bull and bear markets from 2002 to 2009.

The SPX bull market from October 2002 to October 2007 is a very rare example of an almost exact Fibonacci time cycle. Five – years and one – trading day.
The subsequent 2007 to 2009 bear market was unusual. The October 2007 to March 2009 was 17 – months long , not a Fibonacci sequence number but it is half of a Fibonacci sequence number – 34. Perhaps this 17 – month bear market could be matched with a future 17 – month bull market.
The next monthly SPX chart shows the bull market that began in October 2022.
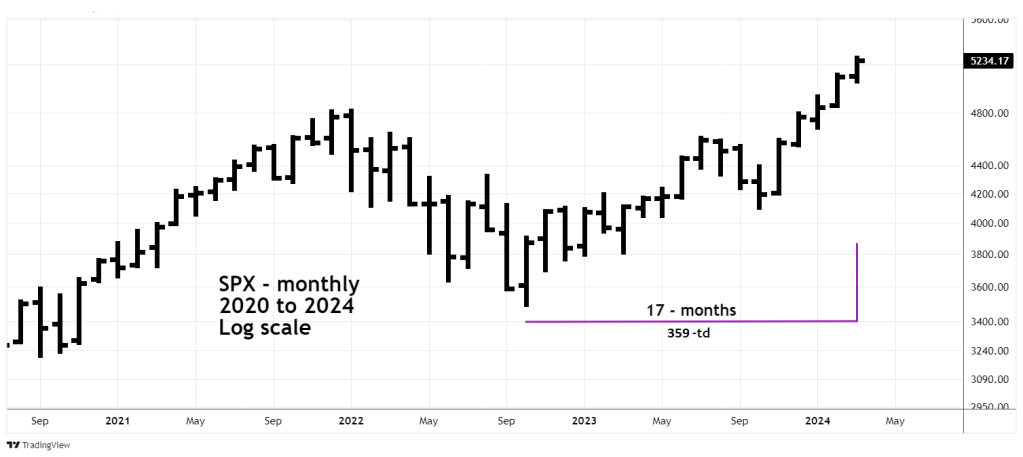
The current bull market is now 17 – months long. As of the high made on 03/21/24 it has lasted 359 – trading days vs. 352 trading days for the 2007 to 2009 bear market.
There’s also a reverse symmetry between the two time periods. The 2007 bear market began in October and ended in March 2009. The 2022 bull market began in October and could end in March 2024.
Markets can occasionally turn on Full/New Moons plus or minus two trading days. The SPX had a bull market peak on 01/04/22. There was a New Moon on Sunday 01/02/22. On Monday 03/25/24 there’s a Full Moon.
The next monthly SPX chart shows the action from 2009 to 2024.
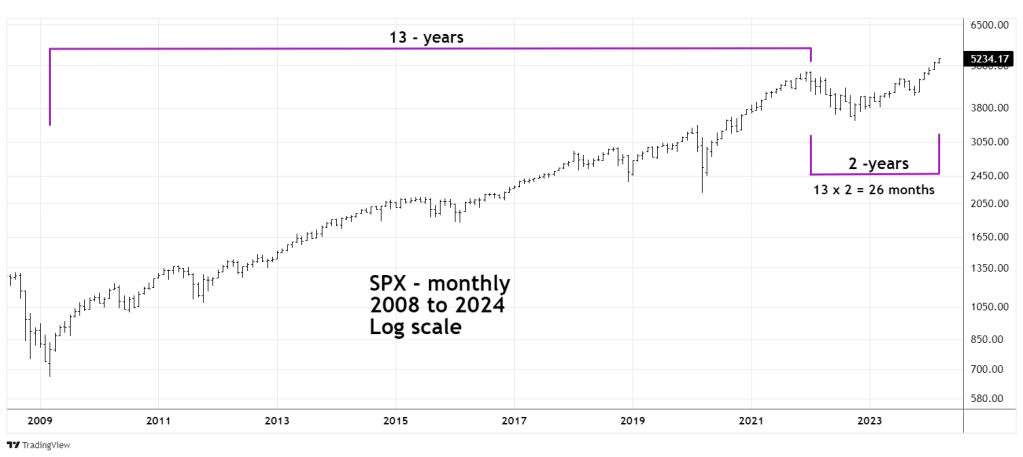
The 13 – year secular bull market from 2009 to 2022 counts as an Elliott Impulse pattern and is presumed to be Cycle wave” I “ of a larger five wave pattern that could continue into the mid twenty first century.
The movement after the January 2022 peak is presumed to be a developing Elliott wave – Expanding Flat correction. The January to October 2022 decline is the presumed Primary wave “A” with the bull market after October 2022 as the presumed Primary wave “B”.
The time distance between the January 2022 top and March 2024 is a Fibonacci 2 – years or in months a multiple of the Fibonacci sequence number 13.
If the current SPX bull market peaks in March 2024 its possible the Fibonacci time cycle could help to determine when the next bear market could end. Perhaps the presumed Expanding Flat correction could last from 2022 to 2025 – a Fibonacci 3 – years.
