Market sentiment indicators measure the emotion of the mass mind. Current sentiment readings for the U.S. stock market imply a major top could be forming.
Market sentiment can be measured by polling and actions taken by market participants. One organization that conducts market polling is Market Vane Inc.
The Bullish Consensus number is derived by polling the buy and sell recommendations of leading market analysts and commodity trading advisers. High bullish percentages indicate a potential market top. Low bullish percentages indicate potential bottoms. For the U.S. stock market readings above 60% imply a major top. Readings below 35% imply major bottoms.
The weekly S&P 500 (SPX) chart courtesy of Trading View illustrates some important Bullish Consensus readings.

Sometimes a market turn can correspond with an extreme Bullish Consensus reading. This happened at the SPX October 2022 bottom. The 33% Bullish Consensus number was the lowest reading for 2022. Sometimes a market turn can come on a divergent reading, this happened in late 2021 and early 2022. The January 2022 reading was slightly below the November 2021 reading which corresponded with a lower SPX peak. This divergence implied a subtle shift to bearish sentiment.
The reading as of early March 2024 has a long-term divergence vs. the January 2022 reading. A short-term divergence could develop, or the reading could go higher. Bullish Consensus readings indicate a general area for potential turns, its possible the SPX could continue higher for a few weeks or a few days. March 2024 is probably a bad time to enter long stock positions.
The CBOE Volatility Index (VIX) is a good indicator to measure sentiment of the SPX. The VIX is derived from the Put/Call options. VIX moves up with increases in put options. VIX up spikes usually correspond with SPX bottoms. However, significant SPX tops usually correspond to higher VIX bottoms. This occurs because some participants increase hedging with Puts – anticipating a market drop.
The daily VIX and SPX chart shows what happened at the SPX top in 2020.

In this cycle the VIX made a bottom at 11.42 on 11/26/19. The SPX ultimate bull market top occurred 56 – trading days later with a higher VIX bottom.
The next daily VIX and SPX chart illustrates the SPX peak in 2022 and the current situation.
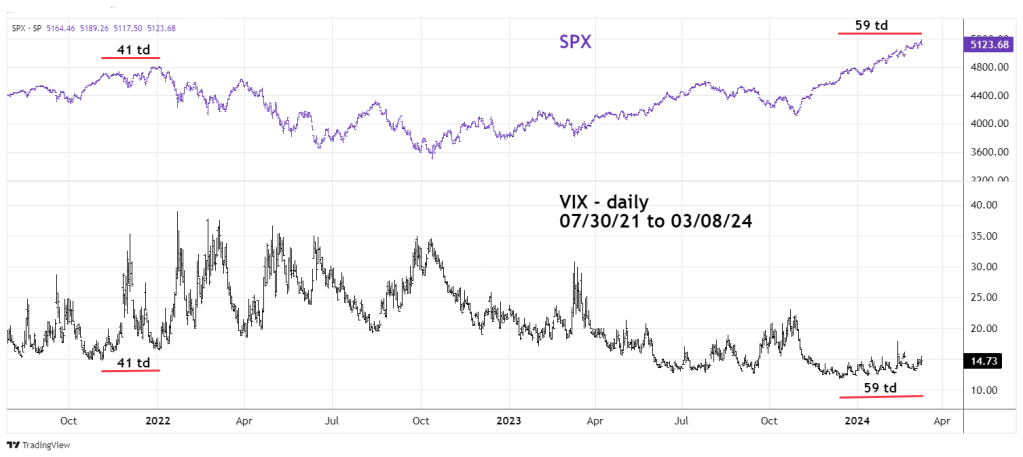
VIX made a bottom on 11/04/21. The SPX ultimate peak came on 01/04/22 – 41 trading days later with a higher VIX bottom.
The SPX all-time high made on 03/08/24 is 59 – trading days after the VIX primary bottom. The VIX/SPX topping phenomenon is very effective, however its is not precise.
Stock market bottoms are usually much easier to discover than tops because fear is a more powerful emotion than hope. Major stock market tops take longer to develop than bottoms and can be frustrating. Evidence indicates a top could be in place, then stocks continue to rise.
All buying manias end at some point. When they do end, those that have ignored the bearish signals will probably experience more than just frustration.
