Longer -term U.S. stocks are in the area of a potential major top. Shorter – term there could be more upside action.
The daily S&P 500 (SPX) chart courtesy of BIgCharts.com updates the short-term view.
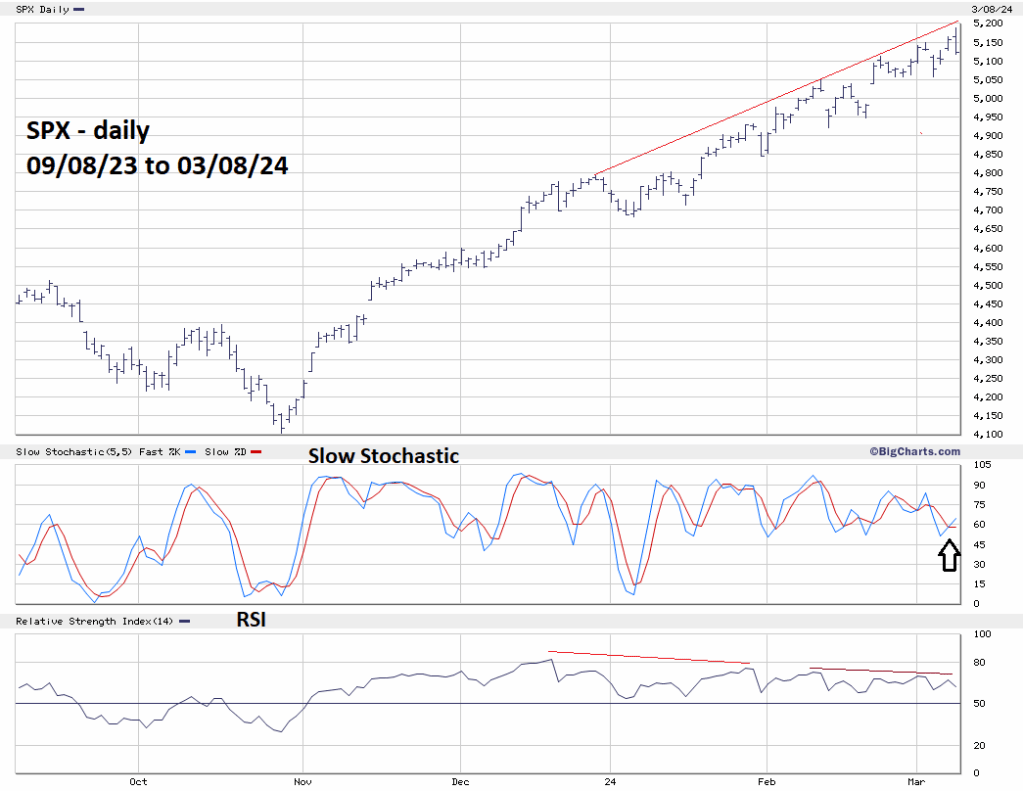
The 03/07/24 blog illustrated the Slow Stochastic lines intersecting. There’s now a bullish crossover below the overbought zone which begins at 80.00. It could be two to three trading days before both lines reach the overbought zone. The SPX has still not reached the rising trendline from late 2023. The intersection point is in the low 5,200 area and could be a zone for a potential top.
Note the daily RSI now has five bearish divergences – an unusually high number. Normally there are at most two, sometimes three bearish divergences. There’s a good chance some of these divergences could be broken, corresponding with high prices.
The weekly SPX chart courtesy of Trading View shows the long-term view.
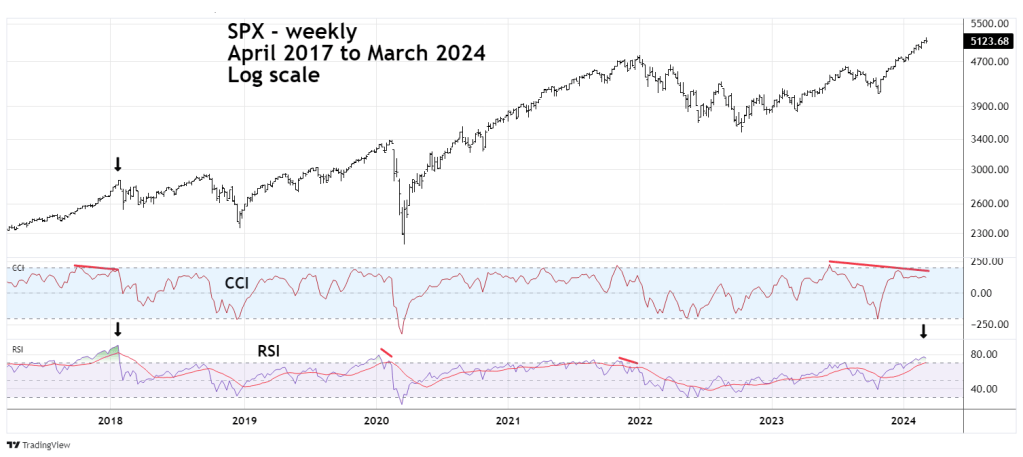
The current SPX rally since October 2023 is similar to the manic SPX rally in late 2017 to 2018. That rally was so intense the weekly RSI reached 90.5 – the highest weekly SPX – RSI reading ever! For stock indices, when RSI reaches the overbought zone there’s usually at least one bearish RSI divergence before price peaks. The SPX top in January 2018 was a rare example of price topping with RSI.
Currently the highest weekly RSI reading is 76.81. The CCI is effective at discovering price peaks even with non-divergent RSI readings. Note that in January 2018 the weekly CCI had a bearish divergence. Currently weekly CCI has a double bearish divergence.
Also note that after the manic SPX top in January 2018 there was a two – week 11% mini crash.
The daily NYSE – 52 – week high ($MAHN) chart courtesy of Barchart.com illustrates internal U.S. stock market momentum.
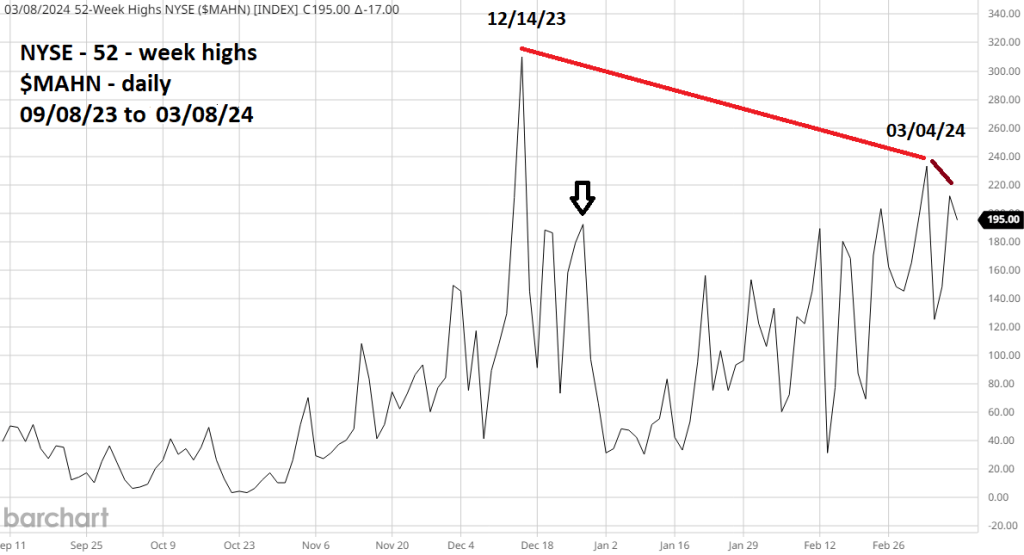
In the late stage of a stock index rally fewer and fewer stock make new rally highs. The NYSE bull move that began in October 2022 reached maximum internal strength on 12/14/23. The first bearish divergence made in late 2023 has been exceeded, yet there’s still a significant bearish divergence.
The level reached on 03/04/24 is now the primary divergent point and a double divergence could occur.
The U.S. stock rally since late October 2023 has appearance of a mania. In this type of bull move some participants buy stocks regardless of Technical or Fundamental evidence. They buy just because prices are rising.
Stock market buying mania’s are rare. The last one in the U.S. was six years ago and ended with an 11% mini crash. The mania prior to that occurred from late 1999 to early 2000, mostly in the technology sector. In March 2000 the tech heavy Nasdaq 100 peaked, then had a four-week 34% crash.
Today’s complacent stock bulls could soon have an unpleasant surprise.
