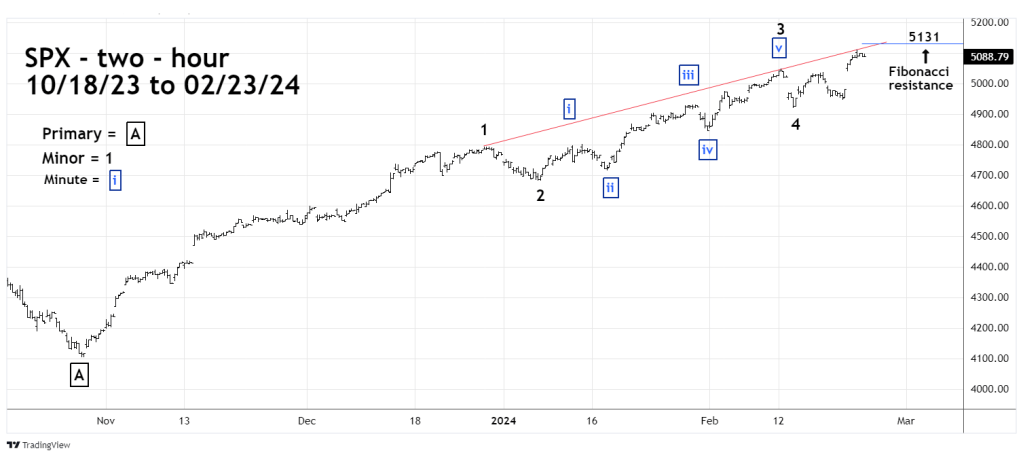
The S&P 500 (SPX) Elliott wave pattern suggests a major Fibonacci resistance point near 5,131 could be hit on 02/27/24.
The two – hour SPX chart courtesy of Trading View illustrates the Elliott pattern from the 10/27/23 bottom.
Analyzing Elliott wave patterns is like putting together a Jigsaw puzzle. Discovering the location of one piece can connect other pieces, and eventually complete the puzzle.
The SPX rally that began on 10/27/23 is a smooth and steady movement with shallow corrections. This is a characteristic of an Elliott – five wave Impulse pattern. If you can correctly determine the subdivisions of an Elliot wave pattern, you have a good chance of finding the patterns termination point.
In any Eliott wave movement there are always alternate counts.
Note that the location of the presumed Minor wave “4” is different than the daily SPX chart illustrated in the 02/22/24 blog “U.S. Stock Market Mania – February 2024”.
The 15 – minute SPX chart shows why this alternate count could be very important.
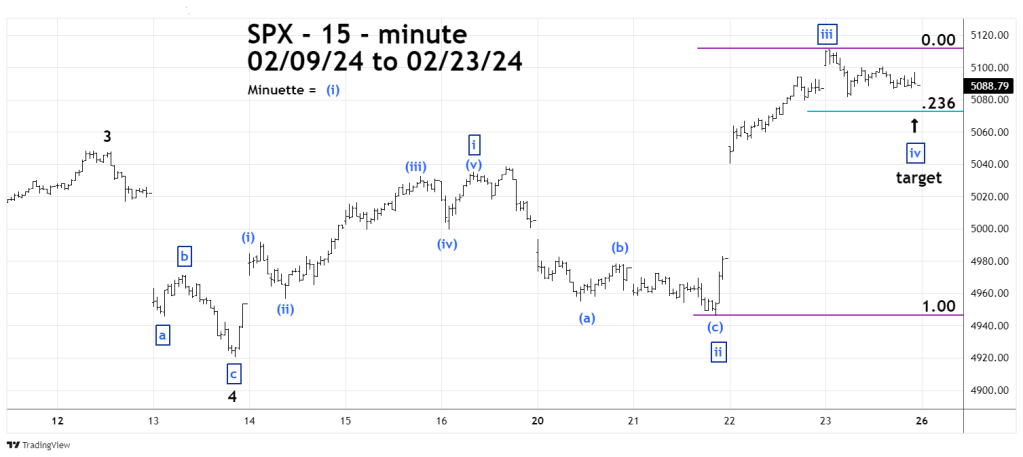
The 02/22/24 blog illustrated Minor wave “4” at the 02/21/24 bottom. In this wave count Minute wave “c” of “4” terminates above the 02/13/24 bottom – the presumed Minute wave “a”. In this situation the presumed Minute wave “c” is truncated. Truncated waves appear in the fifth wave position of motive patterns and in the “C” wave position of corrective patterns. Truncation only appears about 10 to 15% of the time. They create problems for Elliott analysis because it greatly increase the number of alternate counts.
In the revised wave count Minor wave “4” terminates at the 02/13/24 bottom. Minor wave “4” in points is 87% of the presumed Minor wave “2” Equality or near equality is a typical Fibonacci relationship between waves “two” and “four.”
The subsequent rally after the 02/22/24 bottom was very rapid and longer than the presumed Minute wave “I”. It’s likely this structure is Minute wave “iii” of a developing five – wave Impulse pattern. The 02/22/24 to 02/23/24 rally could be the key piece of the Elliott wave puzzle that began on 10/27/23.
Typically, the fourth waves are shallow, usually retracing .236 or .382 of the prior third wave. The reason for shallow retracements is that after a third wave the crowd realizes the direction of the main trend. Which in this case is up. In bullish main trends there’s reluctance to sell and buying continues even on small declines.
Assuming Minute wave “iv” is not complete it could terminate on 02/26/24 somewhere near a .236 retracement of Minute wave “iii” If this scenario occurs it could set up for a final trust up into 02/27/24. The rising trendline connecting Minor wave “1” and “3” intersects with major Fibonacci resistance at 5,131 on 02/27/24.
There are always alternate wave counts. The 02/22/24 blog illustrated the post 10/27/23 rally as the second wave “C” of a developing Double Zigzag. Could this rally be the third wave of a developing five – wave Impulse pattern? Yes it could. However, momentum evidence argues against this interpretation. In stock market third waves, momentum peaks at or near the wave “three” termination point. Several blogs on this website have noted that momentum after the late October 2023 rally peaked in mid- December.
The ideal scenario is the SPX bottoming in the 5,070 area on 02/26/24. A move below SPX 5,040 opens the door to alternate counts.
A move up to the 5,131 area on 02/27/24 could break the fever of the four-month stock buying mania.
