Since October 27, 2023 the S&P 500 (SPX) has rallied more than 23% with only one 2.5% correction. Today the SPX gapped up 2.11% the biggest one-day gain in four months!
The weekly SPX chart courtesy of Trading View shows the long-term Elliott wave count since January 2022.
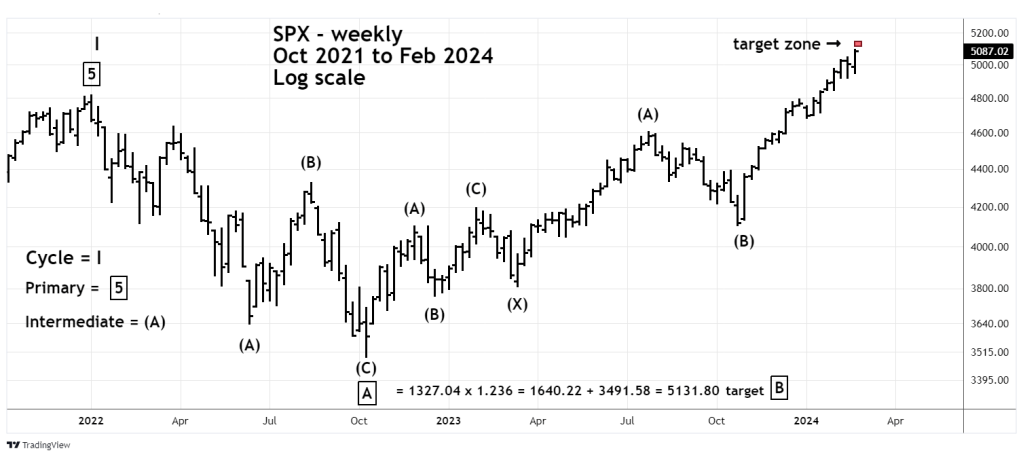
Several blogs on this website have illustrated that the SPX could be forming a multi-year Elliott wave – Expanding Flat from the January 2022 peak. In this pattern the second phase – wave “B” terminates beyond the point of origin of wave “A”. Sometimes the movement beyond wave “A” is marginal. The most common Fibonacci multiple for the length of wave “B” is 1.236 times the preceding wave “A.”
The presumed Primary wave “A” was 1,327.04 points, multiplied by 1.236 equals 1,640.22 points added to the wave “A” bottom of 3,491.58 targets SPX 5,131.80 for the Primary wave “B” top.
The daily SPX charts focuses on the rally off the 10/27/23 bottom.
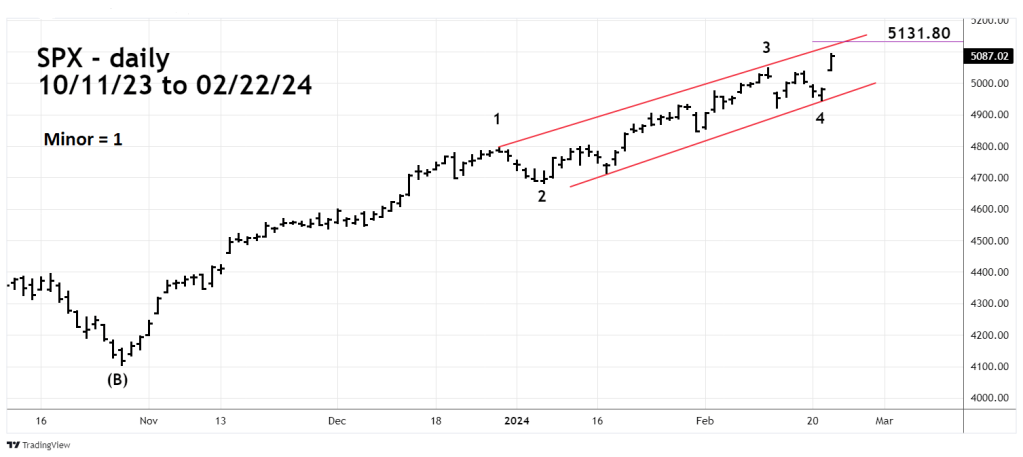
The upper rising trendline crosses near 5,131 on either 02/26/24 or 02/27/24. This is the time zone where Primary wave “B” could peak.
Traders were stopped out of a 100% short position of non-leveraged SPX funds initiated on 02/09/24 the total loss was 1.1%.
Since mid-December 2023 momentum for U.S stocks has been bearish, and that condition continued into today’s massive move up.
The price action of the three main U.S. stock indices since 10/27/23 has the look of a blowoff top- which don’t end well for the bulls. Prices tend to fall faster than they rise.
It’s possible the next significant SPX decline could retrace back to the October 2023 bottom much quicker than four months.
