The S&P 500 (SPX) – intraday Elliott wave patterns suggests a bear market rally peak could occur early in the main session 02/22/24.
The 15-minute SPX chart courtesy of Trading View illustrates the action after the 02/12/24 top.

This updates the SPX chart illustrated in the 02/17/24 blog “Intraday Examination of the S&P 500” which noted intraday momentum indicators were bearish. A decline did occur in what appears to be an Elliott wave Impulse pattern that could be corrected by an Inverse Expanding Flat.
Fibonacci analysis supports this theory. A common Fibonacci relationship between wave “A” and “B” of an Expanding Flat is the Inverse Fibonacci ratio of 1.382.
The length of the presumed Minuette wave (a) is 23.34 points multiplied by 1.382 equals 32.25. The high of Minuette wave (a) is 4,978.36 minus 32.25 equals 4,946.11. The bottom on 02/21/24 was 4,946.00 almost a direct hit.
A Fibonacci .618 retracement is a common area for wave “two’s” to terminate. The presumed Minuette wave( c ) of Minute wave “ii” could top near SPX 5,003.00.
The next 15 – minute SPX chart zooms in on the action of the presumed Inverse Expanding Flat.
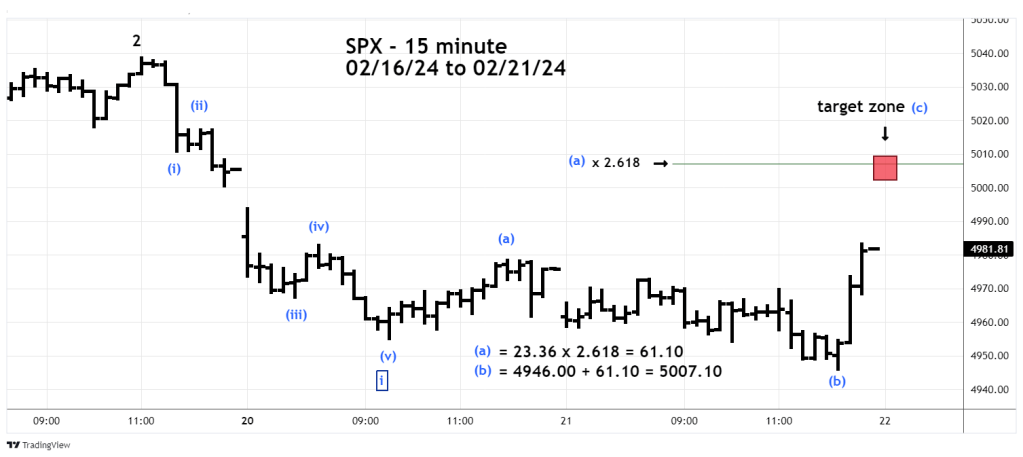
The most common Fibonacci relationship between wave “C” and “A” of and Expanding Flat is that wave “C” is 1.618 of wave “A”. The late session SPX rally high on 02/21/24 was very close to this relationship.
If the SPX exceeded the late 02/21/24 session high, it could reach the level where wave “C” is 2.618 times the size of wave “A”. If this occurs the SPX could peak near 5,007.00 which is close to the primary Fibonacci coordinate of 5,003.00.
The broad zone for a potential SPX peak on 02/22/24 is 5,002.00 to 5,010.00.
As of this writing the S&P 500 – E- Mini futures are up 33 – points which equates to about SPX 5,017. This is thin overnight trading. The big money may have something else in mind when the main SPX session starts at 9:30 AM – ET on 02/22/24.
Watch for what could be a bear market peak somewhere in the low SPX 5,000 area, early in the 02/22/24 main trading session.
