The Russell 2000 – small cap stock index (RUT) has lagged the broader U.S. stock market since late 2021. An examination of RUT – Elliott wave count indicates it could be on the precipice of a severe decline.
The weekly RUT and S&P 500 (SPX) chart courtesy of Trading View illustrates their ongoing divergence.

The actions of both indices from early 2020 to late 2021 are what you would expect in a bull market – they trend together. In late 2021 something different happened RUT began to lag the SPX. RUT’s inability to make a new high in early 2022 was a bearish signal.
In October 2023 RUT made a new bear market low while SPX held significantly above its October 2022 bottom.
Note that after its late 2023 peak RUT is again diverging with the SPX.
The weekly RUT chart shows the big picture Elliott wave count since its all-time high in November 2021.

The November 2021 to June 2022 decline is an Elliott wave – Leading Diagonal Triangle which only appear in the first wave position of motive patterns and in the wave “A” position of corrective patterns. The subsequent multi-month sideways movement is an Elliott wave Inverse Expanding Flat correction.
The daily RUT chart zooms in on the November 2021 to June 2022 decline.

Within the decline Intermediate wave (2) shows a smaller scale Inverse Expanding Flat. Also note the Minor wave “C” of this structure is an Elliott wave – Ending Diagonal Triangle which appear only in the fifth wave position of motive patterns and in the wave “C” position of corrective patterns.
The next daily RUT chart illustrates the multi-month Inverse Expanding Flat.

The sub waves of this structure are very complex. Minor wave “B” of Intermediate wave (B) is a Double Zigzag. The sub waves of the Double Zigzag are smaller degree Double Zigzags.
The final segment of the Inverse Expanding Flat – Intermediate wave (C) is a smooth and steady Impulse pattern.
The hourly RUT chart zooms in on the most recent action.
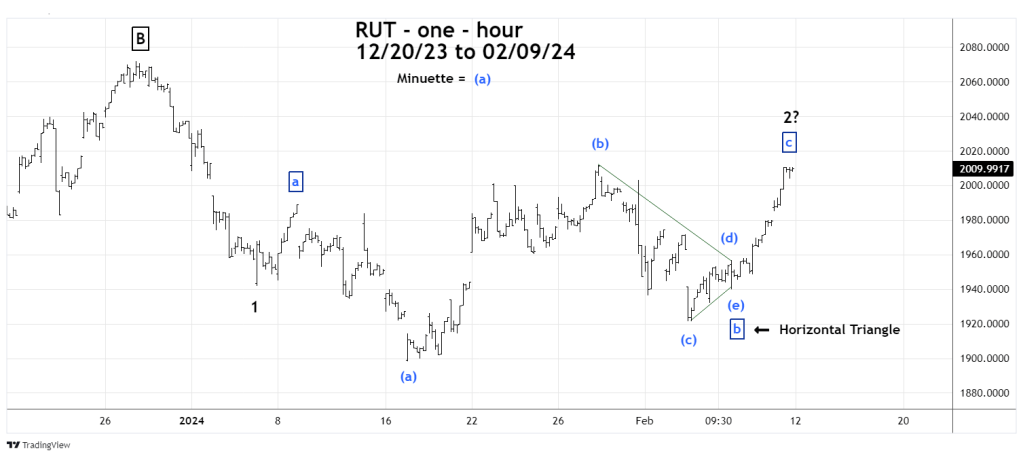
After the initial Impulse wave down, we are again seeing what appears to be a small-scale Inverse Expanding Flat. The most fascinating aspect of this structure is that the presumed Minute wave “b” counts as a Horizontal Triangle. Note to Elliottician’s, in choppy sideways movements there’s a good chance a Horizontal Triangle could be lurking around.
The movement up after the presumed Minute wave “b” has the smooth and steady look of an impulse wave.
February 9, 2024 was the 58th anniversary of the Dow Jones Industrial Average major top at 1,000. There was also a New Moon on 02/09/24. Markets sometimes turn plus or minus two trading days from a New/Full Moon.
A significant decline for U.S. stocks could begin within the next two trading days. Based on Elliott wave analysis of the Russell 2000 – the decline could begin on 02/12/24.
