Today February 8, 2024 the S&P 500 (SPX) reached round number resistance at 5,000. On February 9, 1966 the Dow Jones Industrial Average hit round number resistance at 1,000 and declined 26% in eight months. Something similar could happen to the U.S. stock market in 2024.
The weekly SPX chart courtesy of Trading View shows the big picture.
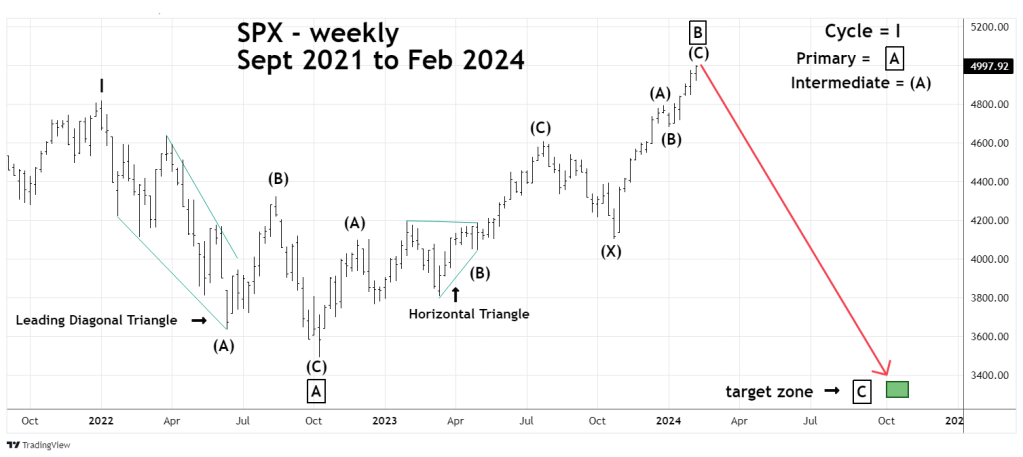
On 02/08/24 the SPX may have completed Primary wave “B” of an Elliott Wave – Expanding Flat that began in January 2022. Wave “C” of this structure subdivides into five waves and ends below the termination point of wave “A”. Usually the “C” wave moves faster than wave “A”. In this case it implies the SPX could decline more in eight months than the nine-month SPX drop in 2022.
The daily SPX chart illustrates the SPX rally from late October 2023.

Sometimes markets can turn on New/Full Moons, plus or minus two – trading days. On 02/09/24 there’s a New Moon.
The 30- minute SPX chart zooms in on the rally from the 01/05/24 bottom.
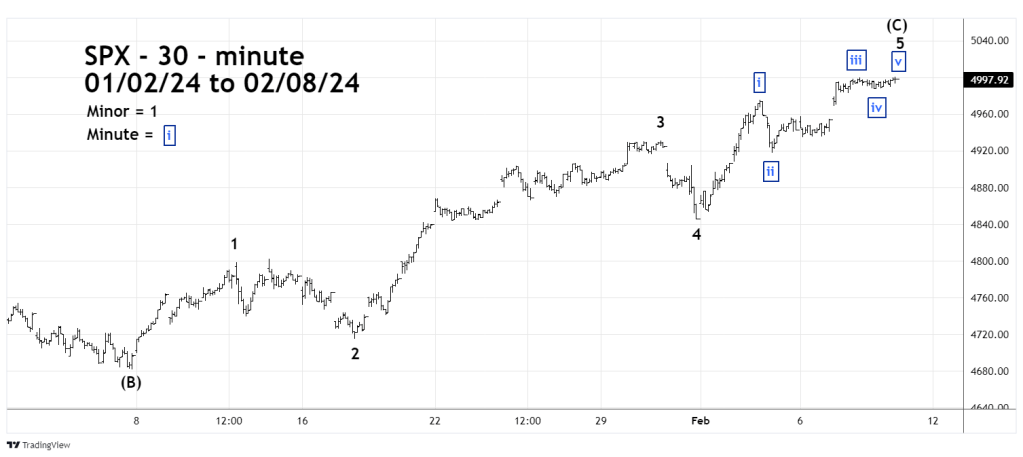
It appears a five – wave Impulse pattern could be complete. Minor wave “5” has extended and has a Fibonacci price relationship with the movement of Minor waves “1” through “3”. Minor wave “5” is .618 the size of Minor waves “1” through Minor wave “3”.
The 5 – minute SPX chart drills down to the action of the prior three trading days.

The SPX looks like it completed an Elliott wave – Horizontal Triangle – Minute wave “iv”. The presumed Minute wave “v” appears to be an Elliott wave – Ending Diagonal Triangle.
If the SPX can manage to move above 5,000 on 02/09/24, it may happen in the first few minutes of the trading session. If this occurs there’s a high probability the SPX could decline throughout the remainder of the session.
There’s an opportunity for traders to establish a 100% short position on non – leveraged SPX funds at the opening of the 02/09/24 trading session. Use a move above SPX 5050.00 as a stop loss on half of the position. Use a move above SPX 5070.00 as a stop loss on the second half of the position.
