Current U.S. stock market sentiment implies a major top could be forming.
There are several ways to measure market sentiment. Examining trader/investor actions such as buying Put or Call options. Another way is by polling trader/investor opinions about a market.
The daily CBOE Volatility Index (VIX) chart and S&P 500 chart courtesy of Trading View illustrates their relationship.

Chicago Board Options Exchange’s CBOE Volatility Index, measures the S&P 500 expectation of volatility based on S&P 500 index options.
When the VIX has large spikes up it usually corresponds to SPX bottoms. VIX moves up when there’s more Put option buying relative to Call option buying.
If VIX spikes up correspond to SPX bottoms it would be reasonable to expect SPX tops to correspond to VIX bottoms. This is not exactly what happens.
SPX makes significant peaks while the VIX is making a higher bottom. Some traders after the VIX makes a primary bottom increase purchases of Put options as insurance against SPX declines.
If the SPX subsequently makes a higher top with the VIX making a higher bottom it indicates a slight shift in sentiment to the bearish side. There could be several VIX higher bottoms before the SPX makes its ultimate peak. It is usually at least a month after the VIX primary bottom before the SPX could make its ultimate top.
The major SPX top on 01/04/22 came 41 – trading days (TD) after the VIX primary bottom in November 2021. On 02/02/24 the SPX all-time high was 35 – TD after the VIX primary bottom in December 2021.
Also note the VIX steeper advance after the SPX 01/24/24 peak, which implies an acceleration of bearish sentiment.
The weekly SPX chart shows data from Market Vane Inc. Bullish Consensus poll.
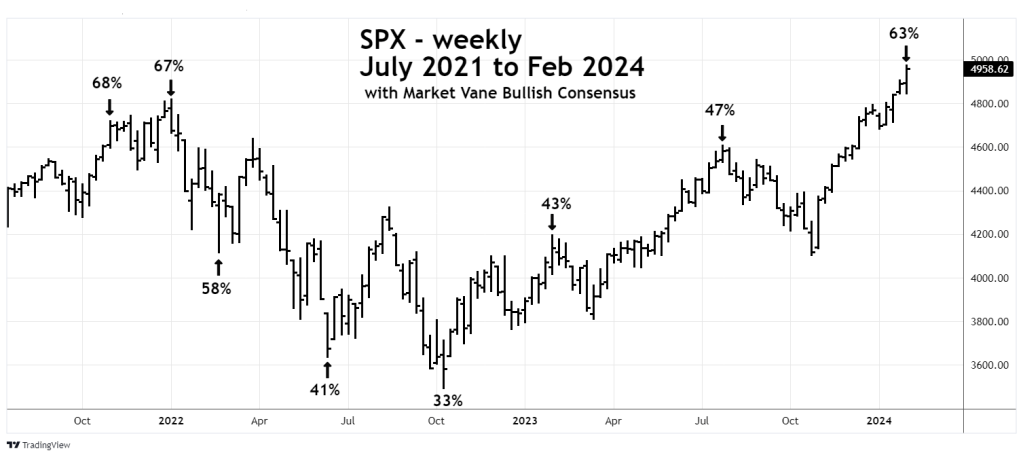
The Bullish Consensus measures the futures market sentiment by following the trading recommendations of leading Commodity Trading Advisors.
For U.S. stocks, readings above 60% usually indicate the formation of a significant top. U.S. stock market readings below 40% correspond to significant bottoms. Sometimes a market turn could match the highest or lowest Bullish Consensus readings. The SPX October 2022 bottom corresponded to the lowest weekly Bullish Consensus reading of 2022.
There could also be bullish/bearish sentiment divergences. Note that the Bullish Consensus reading at the ultimate SPX peak in January 2022 with slightly lower than the reading made at the SPX intermediate top in November 2021. Currently there’s a long-term sentiment divergence with the SPX above its 2022 peak with a lower Bullish Consensus reading.
Sentiment indicators usually cannot predict the exact day of a turn. The current Bullish Consensus reading of 63% is the highest since the October 2022 SPX bottom. There could be higher readings, or the SPX could go higher with a lower bullish consensus reading.
The current sentiment readings imply the U.S. stock market could be making a peak similar to the early 2022 top. If so the SPX could be on the verge of at least a multi- month decline, possibly going below the October 2022 bottom.
