Occasionally markets and individual stocks can turn at Fibonacci time cycle points. Time cycles do not indicate a top or a bottom. Market action going into the times cycle determines the potential turn. The S&P 500 (SPX) has rallied into two potential Fibonacci time cycle.
The daily SPX chart courtesy of Trading View illustrates a Fibonacci time cycle going back to January 2022.
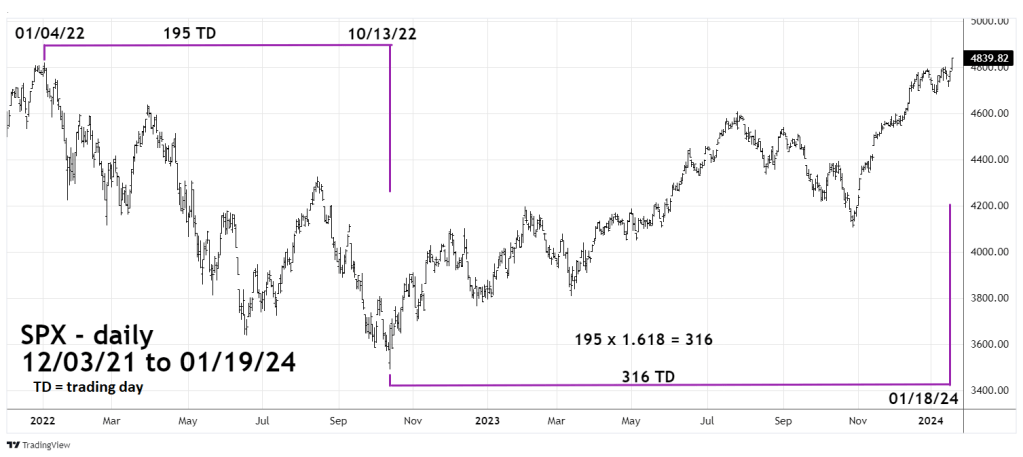
This time cycle shows the Fibonacci time relationship between the January to October 2022 bear phase with the subsequent bull move.
The decline from 01/04/22 to 10/13/22 was 195 trading days (TD). Multiplied by the Fibonacci inverse ratio of 1.618 equals 316 TD. The time from 10/13/22 to 01/18/24 is 316 -TD.
The next daily SPX chart shows a shorter-term Fibonacci time cycle.

When using Fibonacci analysis on price, its more effective to find more than one Fibonacci coordinate. The primary Fibonacci price coordinate measures the larger price segment. Secondary Fibonacci coordinates measures smaller price segments. The closer the two Fibonacci price coordinates are to each other; the greater the chance for a turn.
The same concept applies to Fibonacci time cycle coordinates.
The smaller time segment in this case is the bull phase that began on 10/13/22.
Dividing the post 10/13/22 rally into two parts we see that the peak prior to the largest correction of this bull phase was on 07/27/23. The length of this movement was 196 TD. Multiplying this number by the Fibonacci ratio of .618 equals 121 TD. Projecting this number forward targets 01/19/23 only one trading day after the primary Fibonacci cycle coordinate of 01/18/24.
Using time cycle analysis requires comparison to the Price dimension. The SPX on 01/18/24 and 01/19/24 was rallying into the Fibonacci time zone – indicating a potential top.
Further comparison can be made with the Momentum dimension. As noted in this websites prior blog, the U.S. stock market currently has several outrageous bearish momentum divergences.
There’s a high probability the SPX could begin a decline on 01/22/23. Target zone for at least a short-term bottom is the SPX mid – 4,500 area.
Another factor could be developing. For several weeks this website has illustrated that the SPX could make an intermediate peak in either December 2023 or January 2024. While this could still develop with the ultimate bull market top coming later in 2024, its possible a major peak could be forming now.
The 12/16/23 blog “Projection for S&P 500 Significant Top” illustrated long term SPX – Fibonacci price calculations. The bullseye Fibonacci price coordinate for a major SPX top is 4,889.70. The low end of the leeway zone is SPX 4,842. The SPX high on 01/19/24 was 4,842.
There’s a very good chance the SPX made either an intermediate or major top on January 19, 2024.
