The phenomenon of markets changing direction near a new year was examined in the 12/29/21 blog “Market Turns Near the Turn of a New Year” and noted.
“Occasionally markets could have a turn near a new year. The most logical reason for this phenomenon is to defer taxes on profits into the next year. Another factor could be if a market is approaching a support/resistance level just before or after a new year”.
The spike up in U.S. stocks since 10/27/23, plus the S&P 500 (SPX) Fibonacci price/time ratios noted in the 12/30/23 blog, imply an early 2024 decline.
The daily SPX chart courtesy of Trading View shows what happen at the prior new year turn in 2022.

The SPX top was made on 01/04/23 the second trading day of the year. There was also a lunar cycle turn. Sometimes markets will turn plus or minus two – trading day from a Full/New Moon. There was a New Moon on 01/02/22. The same phenomenon could occur in late 2023. There was a Full Moon 12/27/23. The SPX 2023 high was on 12/28/23.
The next daily SPX chart illustrates a turn of the new year bottom in 2018.

In the second half of 2018 U.S. stocks experience a seasonal September to October decline. The bulls then rallied in seasonally bullish November but could not hold the gains. December had a rare counter seasonal sharp drop. The SPX bottom was made 12/26/18 – three trading days before the end of the trading year. Traders and fund managers hoping for a fresh start began buying late in 2018. What followed was a textbook example of a seasonal – January to late April/early May rally that peaked in the area of the 2018 highs.
The next daily SPX chart from 2005 is fascinating because it could be a preview of what may happen in early 2024.
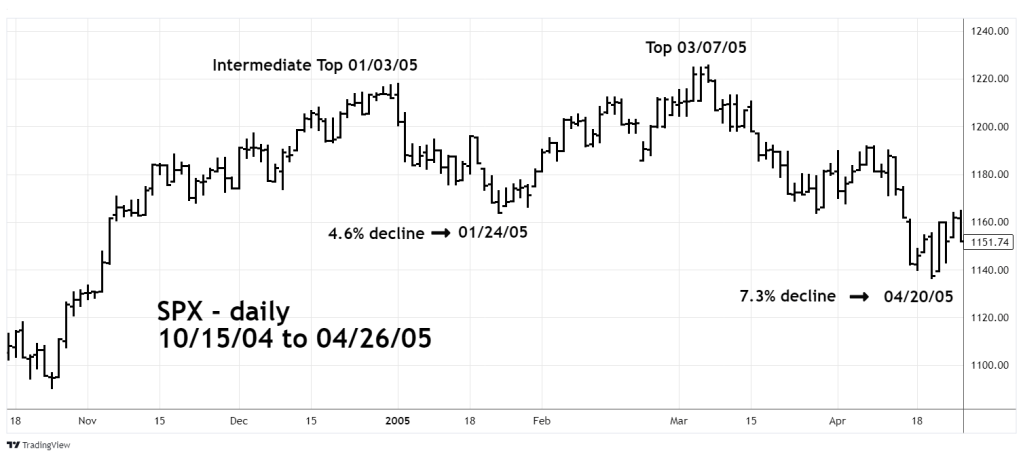
The first trading day of 2005 was 01/03/05. The SPX rallied early in the session and made a new high for the bull phase that began 10/25/04. The rally ended quickly, and the SPX finished the 01/03/05 trading session down sharply. This was the kickoff of a three – week 4.6% decline. Subsequently the SPX rallied and marginally exceeded the 01/03/05 top in early March.
Prior blogs on this website illustrated major Fibonacci resistance points for both the Dow Jones Industrial Average and the SPX which are above their respective 2023 highs.
There’s also the time factor for a primary top that can be measured by the VIX – topping signal.
The 11/25/23 blog “VIX Makes a New 2023 Low – 11/24/23” noted.
“The most recent VIX topping signal at the SPX 07/27/23 peak was 24 – trading days after the VIX primary bottom. Assuming the VIX does not go below its reading made on 11/24/23 – 24 -trading days later is 12/29/23”.
Subsequently the VIX did make a new low on 12/12/23 – 24 trading days later targets 01/18/24. The SPX 12/28/23 top occurred with higher VIX bottom which is an unusually short time for a VIX topping signal – only 11 – trading days. Its more likely for a VIX topping signal on 01/18/24. Please note sometimes VIX topping signals can occur two months or more after the VIX primary bottom.
If the SPX has made an intermediate peak on 12/28/23, the subsequent decline and final rally could stretch out to an ultimate SPX top in February or March 2024.
Either an intermediate or a primary peak for U.S. stocks could be forming late 2023/early 2024.
There’s an opportunity for traders to establish a 100% short position on non – leveraged SPX funds at the opening of the 01/02/24 trading session. Use a move above SPX 4,830.00 as a stop loss on half the position. Use a move above SPX 4,860.00 as a stop loss on the other half.
Happy New Year!
