The Dow Jones Industrial Average (DJI) long – term Elliott wave count is similar to the S&P 500 (SPX). Both indices could be in Elliott wave – Expanding Flats that began in January 2022. Two Fibonacci price projections indicate areas where the DJI could make an important peak.
The monthly DJI chart courtesy of Trading View illustrates the first Fibonacci price projection.
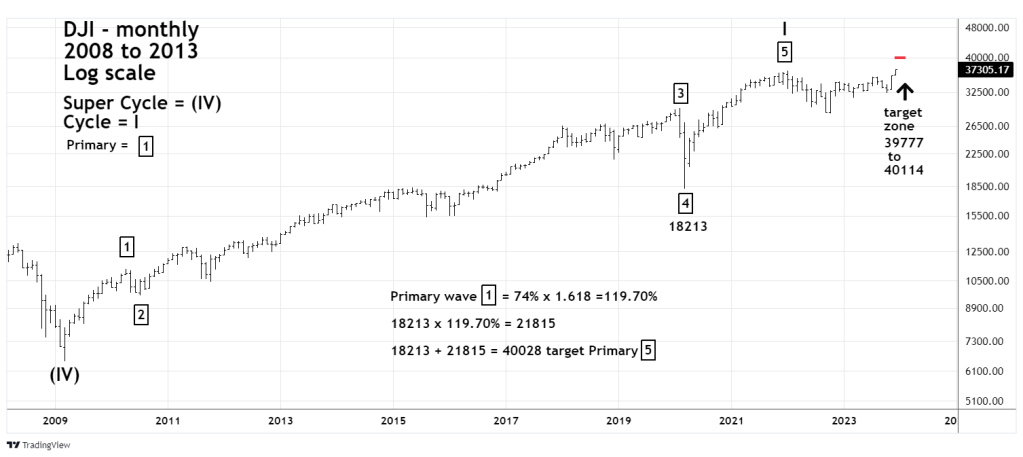
The previous blog about an SPX projection noted that the SPX Primary wave “4” of the presumed Cycle wave “I” was a Horizontal Triangle. The DJI action in 2020 took a different Elliott wave path. The DJI Primary wave “4” terminated at the March 2020 crash bottom. Therefore, the comparison of the DJI Primary wave “1” growth with the Primary wave “5” growth begins at March the 2020 bottom of 18,213.
Multiplying the growth rate of Primary wave “1” by the Fibonacci inverse ratio of 1.618 and adding this to the 18,213 bottom targets DJI 40,028. The leeway zone is from 39,777 to 40,114.
The next monthly DJI chart shows the second Fibonacci price projection.
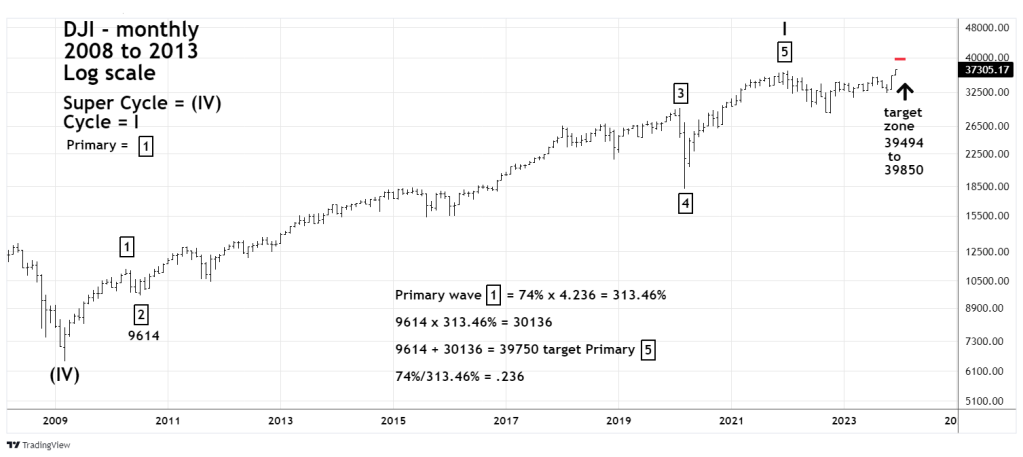
Most of the time there’s a Fibonacci price relationship between waves “one” and “five” of Elliott motive waves. Sometimes there can be a relationship between wave “one” and the progress from wave “two” though “five”.
Multiplying the growth rate of Primary wave “1” by the Fibonacci inverse ratio of 4.236 and adding this to the Primary wave “2” bottom at 9,614 targets 39,750. The leeway zone is from 39,490 to 39,855.
If the DJI can reach the 39,000 area perhaps a top could be made between the lows of each leeway zone. The lowest part of the first leeway zone is 39,777. The lowest part of the second leeway zone is 39,490. Maybe the DJI could top between 39,490 and 39,777?
