If the S&P 500 (SPX) can make a new all-time high it could herald a new bear market.
The 12/14//23 blog noted that the Dow Jones Industrial Average could be forming a Primary degree wave “B” of an Elliott wave – Expanding Flat that began in January 2022. The SPX could be in the process of forming the same structure. Calculations that were made in November 2021 provide clues to where the next very important peak could occur.
The 11/10/21 blog “Possible S&P 500 Topping Zone” speculated that an Elliott wave Cycle degree Impulse wave that began in March 2009 could peak in December 2021. The SPX peaked on 01/04/22.
Within Elliott – motive waves there’s usually a Fibonacci relationship between sub waves “one” and “five”.
The daily SPX chart courtesy of Trading View was originally in the 11/10/21 blog.
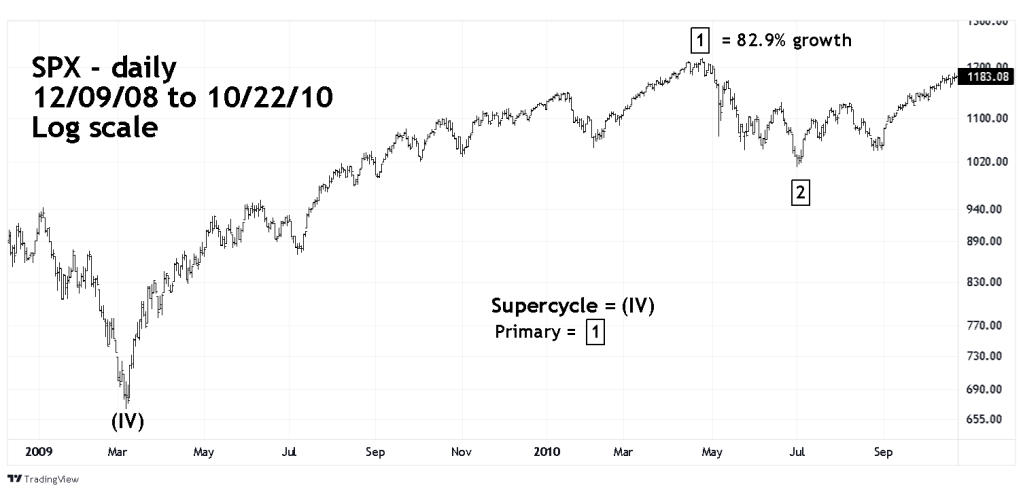
The chart shows Primary waves “1” and “2” of the presumed Cycle wave “I” that peaked in January 2022, When measuring movements with large percentage gains its more appropriate to compare growth rates as opposed to points. The SPX growth from March 2009 to April 2010 was 82.9%.
The next daily SPX chart also originally in the 11/10/21 blog shows the formation of Primary wave “4”.
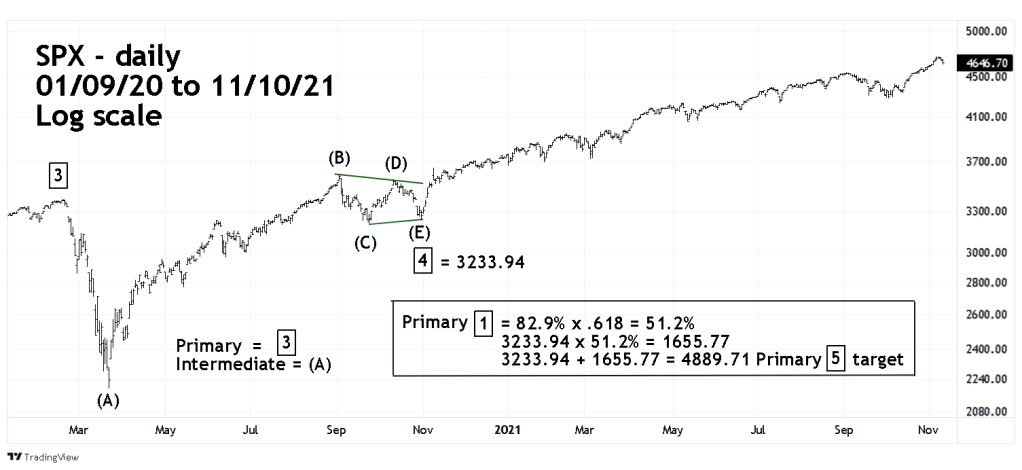
The SPX Elliott wave count of March 2020 to August 2020 had several interpretations. The situation cleared up after the September to October 2020 correction, which appeared to be the last parts of an Elliott wave – Horizontal Triangle. This structure occurs only in the fourth wave position of motive patterns and in the “B” wave position of corrective patterns.
When making Fibonacci projections after a Horizontal Triangle, the end point wave “E” is where the projection begins. In this case it was the October 2020 correction bottom, not the crash bottom made in March 2020.
The Fibonacci projection from the October 2020 bottom had a bullseye target of 4,889, the actual top in January 2022 was 4,818.
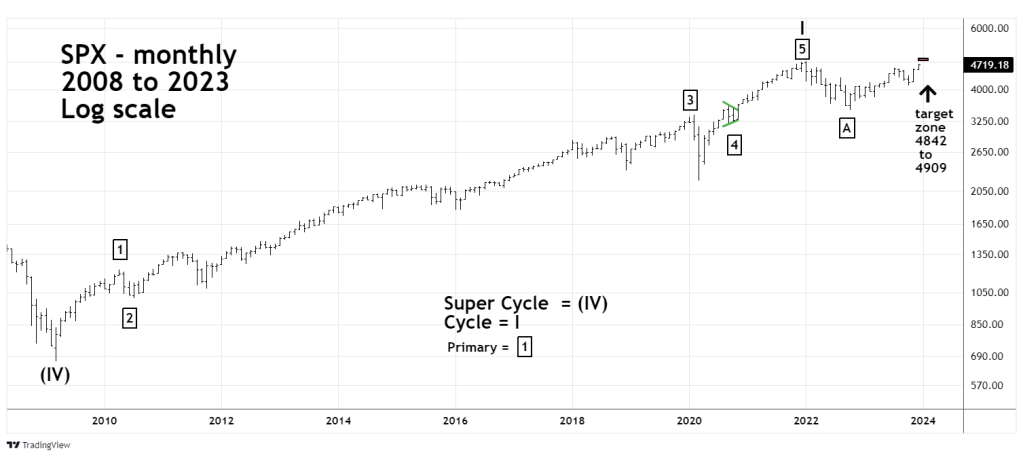
In Robert Prechter’s book “Beautiful Pictures” he noted that wave multiples are often close to Fibonacci fractions. The Fibonacci fraction used on the March 2009 to April 2020 growth rate of 89.2% was .618. Multiples close to this fraction are 3/5 or .60 and 5/8 or .625 using these multiples calculates a leeway zone for the Primary wave “5” of 4,842 to 4909. The January 2022 peak of 4,818 is clearly outside the leeway zone.
Perhaps this leeway zone could still be a resistance area. When a corrective pattern moves beyond the termination point of an Impulse wave, It’s referred to as the “Actual” top or bottom. The impulse wave termination point is called the “Orthodox” top or bottom. Sometimes the Fibonacci relationship between wave “one” and wave “five” can occur at the Actual top/bottom as opposed to the Orthodox top/bottom. In the current context a new SPX all-time high is the presumed Actual top.
The monthly SPX chart shows its progress from March 2009 to the present.
The weekly SPX chart shows its progress since October 2022 with a projection of what may occur in the next few weeks.

The next blog will examine a potential top zone for the Dow Jones Industrial Average.
