On 12/13/23 the Dow Jones Industrial Average (DJI) made a new all-time high. The form of the DJI rally from the October 2022 bottom was choppy, suggesting a corrective pattern. How can the DJI make a new all-time high and be in a correction? In Elliott wave there are two patterns that correct an up trend yet still make upside progress. The two patterns are, Expanding Flats and Running Horizontal Triangles.
The monthly DJI chart courtesy of Trading View illustrates a possible multi-year Expanding Flat that could be forming.
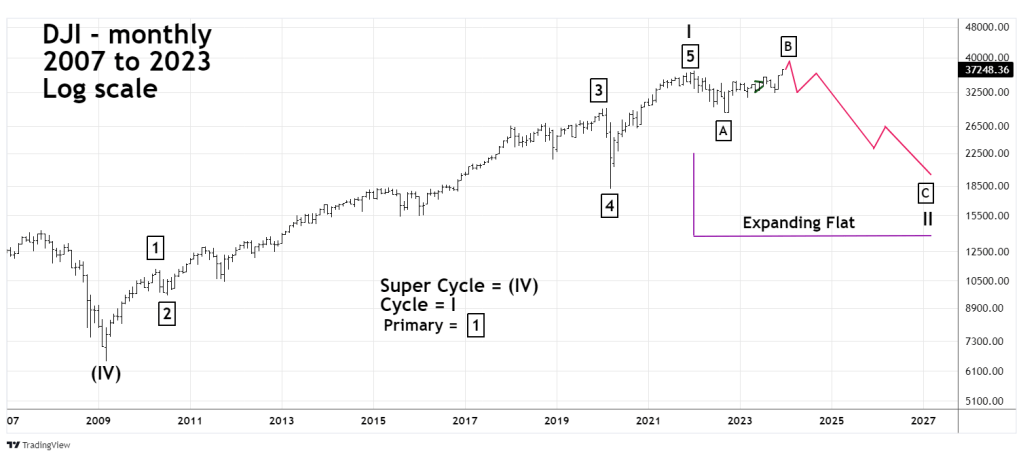
This projection is a guess, it’s possible that a Running Horizontal Triangle could be forming. Both patterns usually have marginal moves above the prior Impulse wave high. In this case that prior Impulse wave high is the January 2022 top. There’s also a third scenario in that a new impulse wave up from the October 2022 bottom is forming. Besides the choppy pattern, momentum evidence from sector analysis suggests a new Impulse wave is a low probability.
Expanding Flats correct up trends. They are composed of three sub waves. The first wave down is composed of three waves or a combination of three waves. The second wave – up is also composed of three waves or a combination of three waves. The upward movement terminates marginally above the Expanding Flat point of origin. In this case January 2022 peak. The third wave down is composed of five waves and terminates below the end of the first wave down. In this case October 2022.
If this scenario develops its possible a five – year Expanding Flat from 2022 to 2027 could correct the thirteen – year Impulse wave from 2009 to 2022.
The weekly DJI chart shows a more detailed Elliott wave view of the rally since October 2022.
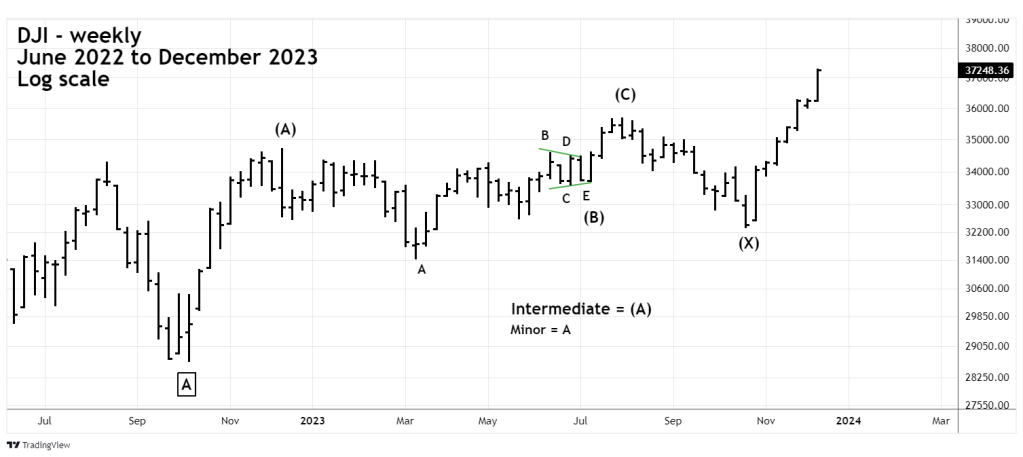
The DJI January to October decline was a Double Zigzag. The post October 2022 rally also appears to be forming a Double Zigzag. The rally from 10/27/23 is probably Intermediate wave (A) of the second Zigzag and could still be under construction. After the presumed Intermediate wave (A) is complete, a decline followed by a final rally is the most likely outcome.
A rough time zone for a possible final peak is from mid-January to late February.
A rough price zone for a presumed top is in the 39,000 area.
The next blog will illustrate narrower price zones for DJI and S&P 500 final peaks.
