The 08/03/23 blog “Stock Market Downgrades U.S. Economy” illustrated an extremely precise Fibonacci time cycle targeting an S&P 500 (SPX) turn on 07/27/23. The SPX 10/13/22 to 07/27/23 rally exactly matched the SPX 01/04/22 to 10/13/22 decline. This precision is very rare, there’s usually leeway around Fibonacci time cycle turns.
There could be another Fibonacci time cycle turn late November or early December 2023.
The weekly SPX chart courtesy of Trading View illustrates a potential time cycle turn point.
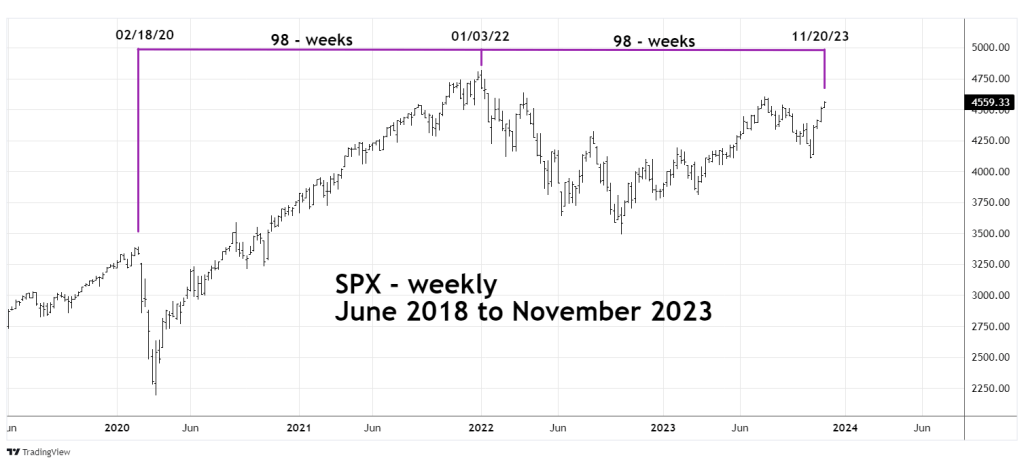
In this case the Fibonacci ratio of equality or 1/1 uses coordinates from the two most important SPX tops since early 2020.
From the week beginning 02/18/20 to the week beginning 01/03/22 is 98 – weeks. Projecting 98 – weeks from 01/03/23 targets the week beginning 11/20/23. On this time scale a leeway of one or two weeks is acceptable.
The 11/23/23 blog “Potential Stock Rally Climax- 11/22/23” noted a Full Moon on 11/27/23 which can sometimes signal market turns plus or minus two – trading days. There’s also a shorter-term Fibonacci time cycle targeting 12/04/23.
U.S. stocks rallying into potential long- and short-term-time cycles implies a top could be made soon.
The current VIX readings illustrated in the 11/25/23 blog implied a peak could be made in late December/early January. A late November top could be a secondary peak prior to a final high on the cusp of the new year. Regardless of the degree, be prepared for a decline in U.S. stocks that could begin in the next few trading days.
