The shorten U.S. stock market session after the Thanksgiving day holiday is usually dull and non-eventful. This year something different happened, the S&P Volatility Index (VIX) made a new 2023 low setting up the possibility for a VIX topping signal.
The VIX topping signal was noted in the 07/22/23 blog “Momentum and Sentiment Evidence – 07/21/23”. A VIX topping signal occurs when the S&P 500 (SPX) makes a primary top with the VIX making a higher bottom.
An example of this phenomenon is illustrated in the daily VIX and SPX chart courtesy of Trading View.
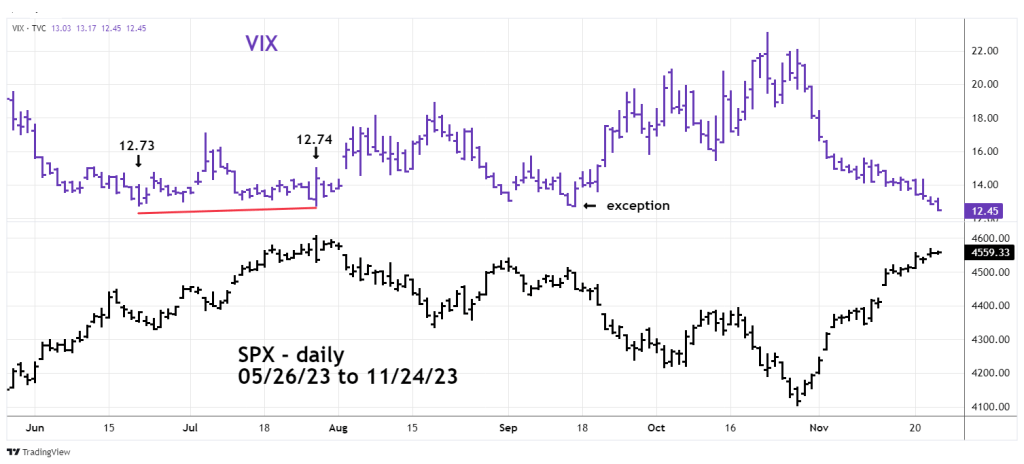
In mid – June 2023 the VIX made a new low after its high made in October 2022 which corresponded with an SPX primary bottom. On 07/27/23 when the SPX made its primary top the VIX made a higher bottom.
On 09/15/23 there was a rare exception. At that date the VIX went below its mid – June bottom just after the SPX made a tertiary peak. Subsequently the SPX went lower into the 10/27/23 bottom – in this case a false set up.
The weekly VIX and SPX chart shows the four effective VIX topping signals since 2018.

Note that the SPX tops in 2018, 2019 and 2022 occurred after the VIX had made more than one higher bottom. Also note that the primary SPX tops happened weeks after the VIX primary bottom.
The most recent VIX topping signal at the SPX 07/27/23 peak was 24 – trading days after the VIX primary bottom. Assuming the VIX does not go below its reading made on 11/24/23 – 24 -trading days later is 12/29/23.
Near-term momentum evidence for U.S. stocks suggests a top could be forming late November or early December 2023. If a peak is made in this time frame, perhaps it could be a secondary top with the primary peak occurring late December 2023 or early January 2024. This scenario fits bullish seasonal patterns and the phenomenon of markets turning at the cusp of a new year.
