The relentless U.S. stock rally that began on 10/27/23 could be in the climax phase.
The weekly S&P 500 (SPX) chart courtesy of BigCharts.com illustrates the long-term view.

Both weekly Slow Stochastic lines have reached the overbought zone above 80%, implying a top could come soon.
However, weekly MACD has a bullish lines cross hinting at a multi-week rally. The weekly Slow Stochastic could stay overbought for more than a month. Please see its action from June to August in 2021.
With conflicting evidence from two external momentum indicators a look at an internal momentum indicator could give us a more definitive picture.
An examination of the daily S&P 500 Bullish Percent Index ($BPSPX) chart courtesy of StockCharts.com views momentum from a different perspective.
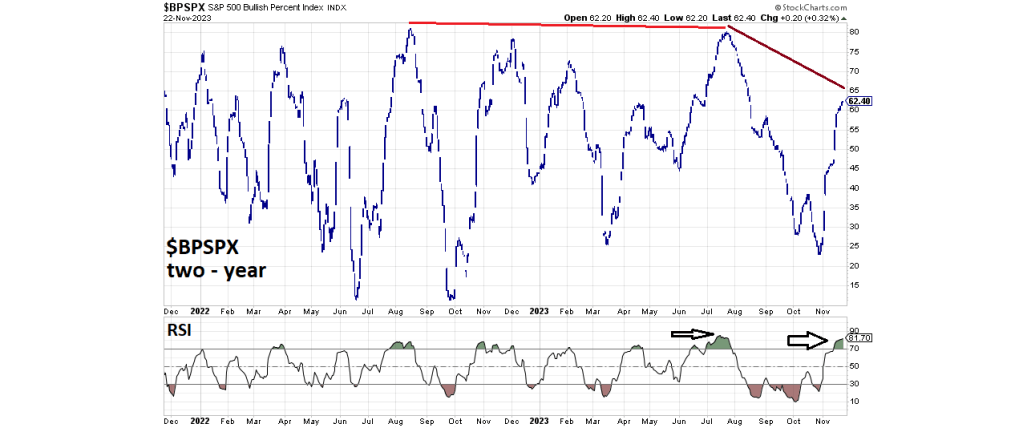
The Bullish Percent Index is a breadth indicator that shows the percentage of stocks on Point & Figure buy signals. Currently the $BPSPX could be forming a SPX topping zone. This phenomenon was noted in the 06/18/23 blog “S&P 500 Topping Zones” and in the 07/29/23 blog “U.S. Stock Market – Internal Momentum 07/29/23.
Using the RSI with $BPSPX can help in determining Stock index topping zones. This tool was helpful in discovering the SPX late July 2023 peak.
At the SPX July 2023 top $BPSPX had a bearish divergence vs. the August 2022 peak. Currently the SPX has not exceeded its late July 2023 top so there’s no $BPSPX bearish divergence. However, $BPSPX is lagging the SPX. As of 11/22/23 the SPX had retraced 92% of its July to October decline. $BPSPX has only retraced 77% of its July to October drop.
The situation is different on the Nasdaq 100. Most of the post 10/27/23 rally comes from the Technology sector. Of the eleven stock sectors in the Nasdaq 100 – the tech sector is the largest constituting 59.2% of the index.
The next daily chart shows the Nasdaq 100 Bullish Percent Index ($BPNDX).
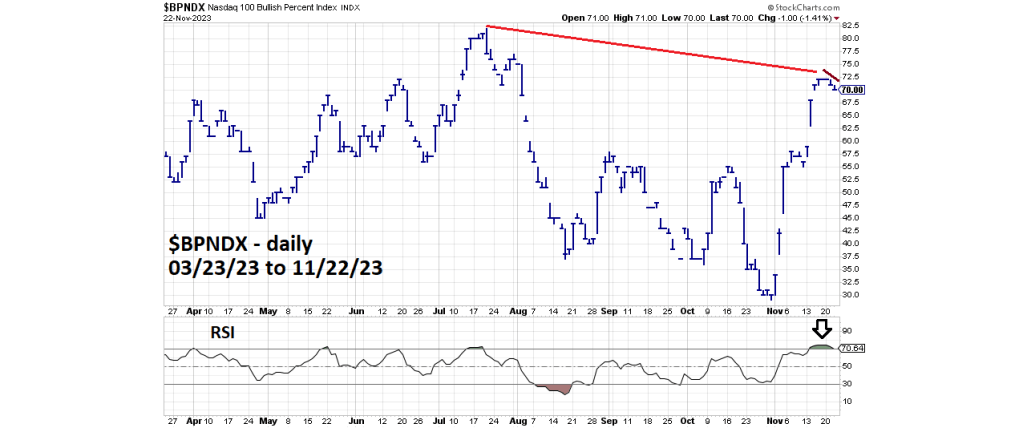
With the Nasdaq 100 above its July 2023 peak there’s a significant $BPNDX bearish divergence. Also note that on 11/22/23 as the Nasdaq 100 made a new post October 2023 rally high, $BPNDX went down.
The next daily chart courtesy of Trading View shows the Nasdaq 100 (NDQ).

In July 2023 the NDQ peaked six – trading days before the SPX. The current double bearish divergence on the $BPNDX could mean the NDQ made an important top on 11/22/23. If so the SPX could peak six – trading days later on 12/01/23.
There’s a Full Moon on 11/27/23. Sometimes markets can turn plus or minus two trading days from a New/Full Moon. On 12/04/23 the SPX post 10/27/23 rally will be in trading days .382 of its July to October decline. The time zone for a potential SPX top is from 11/22/23 to 12/04/23.
Crude Oil – update
On 11/21/23 traders exited the second half of a 50% position in Proshares Ultrashort Bloomberg Crude Oil fund (SCO).
The 50% SCO position was started on 10/16/23 at 17.02.
Subsequently half of the position was stopped out on 10/19/23 at 16.20 for a loss of 2.4%.
On 10/21/23 the second half of the position was reentered at 17.39.
On 11/20/23 a profit of 4.3% was made when the first half of the position was sold at 18.51.
The second half sold on 11/21/23 at 18.55 for a profit of 3.3%.
Total profit for the three trades was 5.2%.
