Today 11/15/23 the S&P 500 (SPX) continued its relentless rally in what appears to be a still developing Elliott wave impulse pattern.
The daily SPX chart courtesy of Trading View illustrates two – external momentum indicators.
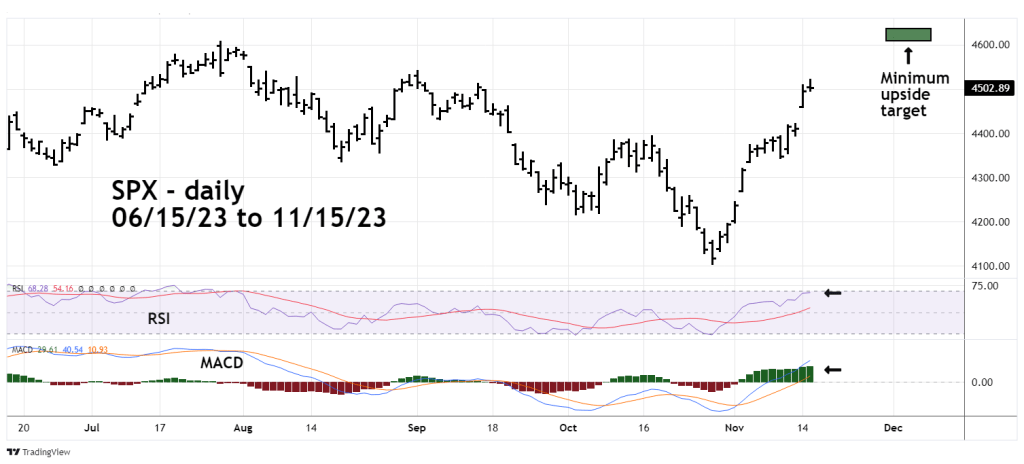
The RSI has reached 68.28, the overbought zone starts at 70.00, and so far there’s no momentum divergence.
MACD – Histogram also has no momentum divergence. These two indicators imply higher SPX prices until the end of November 2023.
There’s a high probability the SPX could reach its 07/27/23 high of 4,607.07.
The next blog on this website will examine the SPX longer – term Elliott wave pattern and how the post 10/27/23 rally could fit within that structure.
